steve_bank
Diabetic retinopathy and poor eyesight. Typos ...
Understanding the Discrete Fourier Transform begins with a dicsussion of cross correlation.
https://en.wikipedia.org/wiki/Cross-correlation
Croos correlation looks for a pattern within a data set or a signal. The equations are in the link. It is a common techique in signall detection.
Consider two signals y1 and y2. Y1 is the sum of two sines. Y2 is a single sine which we look for in y1.
f1 = 1
f2 = 3
f3 = 1
for i = 1:N
y1(i) = sin(2*%pi*f1*(i-1)/(N-1)) + 2*sin(2*%pi*f2*(i-1)/(N-1))
y2(i) = sin(2*%pi*f3*(i-1)/(N-1))
end
The numerical correlation between y2 and y1 is
sum = 0
for i = 1:N
sum = sum + (y1(i)*y2(i))
end
sum = sum/N
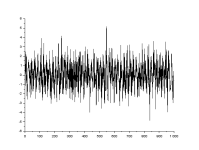
Currelation is used to detect a signal out of noise.
r =grand(N,1,"nor",0,1)
y1 = y1 + r
Running the correlation without nose has a correlation of 0.5, with noise 0.499.
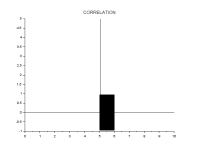
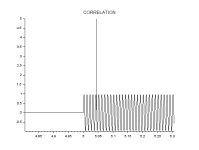
A SONAR example. Send out a pulsed dine and detect when the echo returns.
clear
NCOR = 100; NSIG = 10000 ;
TSTART = 5.; TSTOP = 6. ;
FSIG = 100 ; FCOR = 100. ;
THRESHOLD = 20.
function [sig,sig_cor,t] = make_signal(nsig,ncor,fsig,fcor,tstart,tstop)
_time = 0.; dt = .001;
for i = 1:nsig
...t(i) = _time
...sig(i) = sin(2*%pi*fsig*t(i))
..if((_time <= tstart) || (_time >= tstop)) sig(i) = 0.;end;
.._time = _time + dt
end//i
for i = 1:ncor sig_cor(i) = sin(2*%pi* fcor*t(i));end
endfunction
function [tc,index,c] = cor(sig,sig_cor,nsig,ncor,threshold)
tc = zeros(nsig,1)
flag = 1; index = 1;
for i = ncor:nsig
.._sum = 0.
// auto regressive.
..for j = 1:ncor _sum = _sum + (sig_cor(j) *sig(i-j+1));end;
...c(i) = _sum
...if(_sum > threshold && flag)
...tc(i) = 5; flag = 0; index = i;
...end
end
endfunction
[sig,sig_cor,t] = make_signal(NSIG,NCOR,FSIG,FCOR,TSTART,TSTOP)
[tc,index,c] = cor(sig,sig_cor,NSIG,NCOR,THRESHOLD)
printf(" Time To Target %f\n",t(index)/2)
v = 10//meters/sec
printf(" Distance To Target %f\n",v*t(index)/2)
w2 = scf(2)
clf(w2)
plot2d(t,sig)
plot2d3(t,tc)
title("CORRELATION")
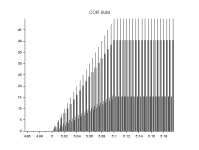
w4 = scf(4)
clf(w4)
plot2d3(t,c)
title("COR SUM")


