• Welcome to the new Internet Infidels Discussion Board, formerly Talk Freethought.

Map Projections

lpetrich

Contributor
Joined
Jul 27, 2000
Messages
25,055
Location
Eugene, OR
Gender
Male
Basic Beliefs
Atheist
The problem of representing our homeworld's surface on a flat surface is a problem that has been recognized for nearly two thousand years, as far back as Claudius Ptolemy (ca. 150 CE), not only an astronomer but also a mapmaker.

Flattening the Earth: Two Thousand Years of Map Projections, Snyder is a detailed history of this subject.

It is mathematically impossible to exactly represent the surface of a sphere on a flat surface, something shown by mathematician Carl Friedrich Gauss in 1827. He showed that the curvature of a surface can be found from inside the surface, by finding what polygons' angles sum to, among other things:

(Sum pf polygon angles) = (((number of sides) - 2) * pi) + (integral of curvature over polygon area)

So one has a choice between straight sides and unchanged angles.

But numerous approximate solutions have been developed over the centuries, solutions which often preserve some property out of all the properties that they sacrifice.
 
Meanwhile on Datums, Datums, and Datums.

New North America Datum coming.

I shall be much obliged if you point a brief summary of what's best about Datum 2022.
(Dont compare it to Datum 2020 or whatever, I've no idea. Just give me some simple retrieves that might show pleasure, puzzle, etc.)
What format is the data datums in?
 
Last edited:
The problem of representing our homeworld's surface on a flat surface is a problem that has been recognized for nearly two thousand years, as far back as Claudius Ptolemy (ca. 150 CE), not only an astronomer but also a mapmaker.

Flattening the Earth: Two Thousand Years of Map Projections, Snyder is a detailed history of this subject.

It is mathematically impossible to exactly represent the surface of a sphere on a flat surface, something shown by mathematician Carl Friedrich Gauss in 1827. He showed that the curvature of a surface can be found from inside the surface, by finding what polygons' angles sum to, among other things:

(Sum pf polygon angles) = (((number of sides) - 2) * pi) + (integral of curvature over polygon area)

So one has a choice between straight sides and unchanged angles.

But numerous approximate solutions have been developed over the centuries, solutions which often preserve some property out of all the properties that they sacrifice.

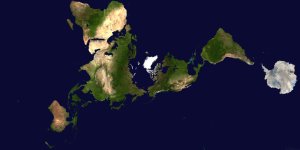
It's a real issue, at times. Tis not for naught that they called geography the "Science of Princes". In my courses, I either use Google Earth screenshots with a US state for size reference, a slice of the Dymaxion Map, some combination of the above, or a local ethnogeographic artifact. It's not uncommon to find me editing new maps of my own on the weekends, disatisfied with what exists in the public domain for a given subject.

Dymaxion Base map.jpg
 
Map projections have a variety of things that they can preserve, even though they cannot preserve all at once. For instance, a projection can preserve at most one of these things:
  • Distances from some point
  • Areas
  • Shapes, including angles -- conformal projections
  • Geodesics, shortest-distance curves -- the gnomonic projection
About the last one, the geodesics of a plane are straight lines, something true of every flat space. The geodesics for a sphere are great circles, circles with their centers at the sphere center. The equator and lines of longitude are all great circles, though non-equator lines of latitude are not.

For instance, shape preserving and geodesic preserving are incompatible because the sum of the angles of a plane triangle is 180d (pi), and the sum of the angles of a spherical triangle is more than 180d. Either the angles become distorted or the edges become curved -- or both.

I have general proofs for the incompatibility of preserving areas, shapes, and geodesics, proofs that work in any number of dimensions and with any variations in curvature. I derived these results by finding what is necessary for a mapping, and showing that any two properties together means that the space metrics have to be identical to within scaling. I still have to work on distance-preserving, however.
 
I will now go into more detail.

Azimuthal projections

A simple construction is a plane touching a sphere at one point. That point is then the origin of polar coordinates on that plane, with the radius being a function of angle on the sphere from the touching point, and the angle being the angle around that point.

The angle from the touching point is the colatitude or (90d - (latitude)), with the (co)latitude being relative to that touching point.

The radius r on the plane is a function of that angle: a

Azimuthal equidistant projection
Distance-preserving, for the distance from the touching point
r = a

In the United Nations flag.

Lambert azimuthal equal-area projection
Area-preserving
r = 2*sin(a/2)

Stereographic projection
Shape-preserving (conformal)
r = 2*tan(a/2)

One can construct it by making a line from the touching point's antipode through the sphere to the plane.

Gnomonic projection
Geodesic-preserving
r = tan(a)

One can construct it by making a line from the sphere's center through the sphere to the plane, if it hits the plane.

Orthographic projection

r = sin(a)

This projection is what one sees when one views from long distances, much larger than the size of the sphere.
One can construct it by making a line perpendicular to the plane and finding where it hits, if it hits the sphere.
 
Cylindrical projections

Wrap the plane around the sphere, making a cylinder that touches it at a great circle.

The projection's latitude is the angle from the touching great circle: b

The two rectangular coordinates are x = (projection's longitude) and y = (function of b)

Equirectangular projection
Distance-preserving, for the distance from the touching great circle
y = b

Lambert cylindrical equal-area projection
Area-preserving
y = sin(b)

Mercator projection
Shape-preserving (conformal)
y = log(tan(b/2 + 45d))


Conical projections

Halfway between azimuthal projections and cylindrical projections. Wrap the sphere in a cone shape around the sphere.

The formulas for them are somewhat complicated. With longitude p and reference longitude p0, reference latitude b0, and function H of latitude b,
x = H(b)*sin(n*(p-p0))
y = - H(b0) + H(b)*cos(n*(p-p0))

where in general, n will not be an integer.

Equidistant conic projection
Distance-preserving, for the distance along the projection's central meridian
H(b) = H0 + b

Albers projection
Area-preserving
H(b) = sqrt(H0 - H1*sin(b))

Lambert conformal conic projection
Shape-preserving (conformal)
H(b) = H0*(cot(b/2 + pi/2))^n
 
Pseudocylindrical projections

These ones are like cylindrical projections, but with less extent in the longitude direction for higher latitudes.

In general,
x = W(b)*p
y = H(b)

where p is the projection longitude, extending from -pi to +pi (-180d to +180d)

Sinusoidal projection
Equal-area
W(b) = cos(b)
H(b) = b

It looks pointed at the poles.

Mollweide projection
Equal-area
W(b) = (2/pi)*cos(w)
H(b) = sin(w)

where auxiliary quantity w satisfies (2w) + sin(2w) = pi*sin(b)

This projection has an elliptical boundary, and it is often used for all-sky maps in astronomy.
 
Conformal (shape-preserving) transforms have an interesting mathematical property. Once one gets from the sphere to the plane, then one can use any plane-to-plane conformal transform.

For x,y to x',y', one can express the transform as
x' = f(x,y)
y' = g(x,y)

For it to be conformal, the partial derivatives of f and g must be related in this fashion:
df/dx = dg/dy
df/dy = - dg/dx

One gets some big simplification by making the coordinates complex numbers: z = x + i*y
z' = F[z) -- F is a function of z and not of its complex conjugate. Thus being an "analytic function".

Applying this to map transforms, let us start with a flipped Mercator transform:
z = log(tan(a/2)) + i*p

e^z = tan(a/2)*(cos(p) + i*sin(p)) -- the stereographic projection, the azimuthal conformal one.

Likewise, e^(n*z) gives us the Lambert conformal conic projection.

There is a nice example of what one can do with conformal transforms, the  Peirce quincuncial projection

Using the Jacobi elllptic function sd,
sd( z'*sqrt(2), 1/sqrt(2) ) = sqrt(2)*z
z = stereographic projection with scale 1/2 at center
z' = PQ projection

The elliptic functions make the map tiled in both dimensions.
 
Naming the inventors of various map projections, Johann Lambert might top the list with several different projections. This amazing polymath was one of the greatest 18th-century geniuses, but his fame is drowned out by names like Lagrange and Gauss (who each also designed map projections).

Prior to Lambert, inventors of map projections include three ancient Greeks — Thales, Hipparchus, and Ptolemy — and, from the 11th century in the Golden Age of Islamic Science, Abu Rayhan Mohammed ibn Ahmad Al-Biruni. Like Lambert, al-Biruni was a great polymath who is often overlooked. He is credited with the azimuthal equidistant projection and the Nicolosi polyconic method.
 
The projection that tells us what we really need to know...

3638e2ad8e7f4386e04279587cc4a970.jpg
 
There is another kind of distance-preserving map projection, the all-distance one:

Two-point equidistant projection

One chooses two reference points and then uses the great-circle distances to those points.

Chamberlin trimetric projection

Uses three reference points, but since one cannot get an exact match of distances, one calculates the intersection for each pair of reference points then the average of those.


The previously-mentioned kind was a distance-angle one.
 
The azimuthal and cylindrical equidistant projections are special cases of Riemannian or geodesic normal coordinates, a generalization of polar and spherical coordinates.

Consider finding the coordinates of some point X.

One starts with some reference point O and then finds the geodesic between O and X, leaving aside the question of its uniqueness. The geodesic-normal coordinates are thus (distance from O to X along the geodesic, direction along the geodesic at O).

I tried to analyze that case, and I found it difficult, much more difficult than being area- or volume-preserving, shape-preserving, or geodesic-preserving. One can analyze it near the reference point, but that requires expanding in a series near it, and doing so becomes *very* difficult *very* quickly. The space metric turns out to be a power series in the position relative to the reference point, with the coefficients being functions of the space curvature that get very complicated very quickly.
 
Creating a more accurate flat map of the Earth
noting
The Most Accurate Flat Map of Earth Yet - Scientific American

"Previously, Goldberg and I identified six critical error types a flat map can have: local shapes, areas, distances, flexion (bending), skewness (lopsidedness) and boundary cuts."

It is mathematically impossible for a sphere-to-plane projection to get everything right, so one must compromise.
The object here is to find map projections that minimize the sum of the squares of the errors—a technique that dates back to the mathematician Carl Friedrich Gauss. The Goldberg-Gott error score (sum of squares of the six normalized individual error terms) for the Mercator projection is 8.296. The lower the score, the smaller the errors and the better the map. A globe of the Earth would have an error score of 0.0. We found that the best previously known flat map projection for the globe is the Winkel tripel used by the National Geographic Society, with an error score of 4.563. It has straight pole lines top and bottom with bulging left and right margins marking its 180 degree boundary cut in the middle of the Pacific.
It's double-sided, a squashed-globe map.
This double-sided map has a Goldberg-Gott error score of only 0.881 versus 4.563 for the Winkel tripel. It beats the Winkel tripel in each of the six error terms! It has zero boundary cut error since continents and oceans are continuous over the circular edge. It has a remarkable property no single-sided flat map possesses: distance errors between pairs of points (such as cities) are bounded, being off by only at most plus or minus 22.2 percent. In the Mercator and Winkel tripel projections, distance errors blow up as one approaches the poles and boundary cuts.
 
New World Map Tries to Fix Distorted Views of Earth - The New York Times

Princeton astrophysicists re-imagine world map, designing a less distorted, 'radically different' way to see the world

Curvature in Map Projections
How do you take a sphere and best project it onto a flat surface so that you can carry it around on a sheet of paper, or, better yet, view it on your monitor. The answer certainly depends on what you want to use your map for. Historically, people have used the Tissot Indicatrix in order to provide guidance. The method is simple: Imagine painting small circles on the earth (or any other planet -- above, we project the surface of Jupiter), and project the surface of the earth (and the circles) onto the map. Some applications will require that all of the circles still be circular (conformal projections). Some will require that all circles be of equal area. No map projection can meet both criteria.

J. Richard Gott and I wanted to take this analysis another step forward. What happens when you project large bodies: the US-Canada Border, for example, or Australia, or the bands of Jupiter, onto a particular map projection? Are the features faithfully reproduced? To that end, we have introduced a formal measure of the flexion and skewness of a map.

This can be visualized simply via the Goldberg-Gott Indicatrices. Pick a point on the earth and drive north 12 degrees (about 1300 kilometers). Even if you hit the north pole, don't turn your steering wheel. Follow a geodesic. Do the same thing but heading west, east, and south. From your perspective, you've drawn a big plus sign on the ground. When projected onto a map, this indicatrix immediately reveals the curvature of the projection. Moreover, if you connect the dots and close the indicatrix, you get an ellipse -- the Tissot ellipse.

Rich and I have evaluated about 20 different projections and measured them with respect to area preservation, ellipticity of the Tissot, flexion (the bending of geodesics), skewness (the rate of change of speed on a map), boundary cuts, and interruptions between random points. All in all, we found that the best two overall projections are (respectively), the Winkel-Tripel (left), and the Kavrayskiy VII (right). See if you agree with our numerical assessment.
But these articles don't give the math behind the projections and the error measures.
 
[2102.08176] Flat Maps that improve on the Winkel Tripel
Goldberg & Gott (2008) developed six error measures to rate flat map projections on their verisimilitude to the sphere: Isotropy, Area, Flexion, Skewness, Distances, and Boundary Cuts. The first two depend on the metric of the projection, the next two on its first derivatives. By these criteria, the Winkel Tripel (used by National Geographic for world maps) was the best scoring of all the known projections with a sum of squares of the six errors of 4.563, normalized relative to the Equirectangular in each error term. We present here a useful Gott-Wagner variant with a slightly better error score of only 4.497. We also present a radically new class of flat double-sided maps (like phonograph records) which have correct topology and vastly improved error scores: 0.881 for the azimuthal equidistant version. We believe it is the most accurate flat map of Earth yet. We also show maps of other solar system objects and sky maps.

Gott and Goldberg earlier wrote
[astro-ph/0608501] Flexion and Skewness in Map Projections of the Earth
Tissot indicatrices have provided visual measures of local area and isotropy distortions. Here we show how large scale distortions of flexion (bending) and skewness (lopsidedness) can be measured. Area and isotropy distortions depend on the map projection metric, flexion and skewness, which manifest themselves on continental scales, depend on the first derivatives of the metric. We introduce new indicatrices that show not only area and isotropy distortions but flexion and skewness as well. We present a table showing error measures for area, isotropy, flexion, skewness, distances, and boundary cuts allowing us to compare different world map projections. We find that the Winkel-Tripel projection (already adopted for world maps by the National Geographic), has low distortion on most measures and excellent quality overall.
 
 Tissot's indicatrix - This is a measure of map-projection quality, doing so by showing the projection's amount of distortion at each point.

(offsets on projection) = T . (offsets on sphere)

For latitude b and longitude p to flat coordinates x and y:

T11 = dx/db
T12 = 1/cos(b) * dx/dp
T21 = dy/db
T22 = 1/cos(b) * dy/dp

Area ~ det(T), so an equal-area transform keeps det(T) constant.

The indicatrix is, as far as I can tell, D = transpose(T) . T

Conformal: D = (some function) * I (the identity matrix)

Let's find T and D for some projections.

Azimuthal: x = r(b)*cos(p), y = r(b)*sin(p)

T = {{r'*cos(p), - r/cos(b)*sin(p)}, {r'*sin(p), r/cos(b)*cos(p)}}
det(T) = r'*r/cos(b)
D = {{(r')^2, 0}, {0, (r/cos(b))^2}}

Cylindrical: x = p, y = h(b)

T = {{0, 1/cos(b)}, {h', 0}}
det(T) = - h'/cos(b)
D = {(h')^2, 0}, {1, (1/cos(b))^2}}

Pseudocylindrical: x = p*w(b), y = h(b)

T = {{p*w', w/cos(b)}, {h', 0}}
det(T) = - h'/cos(b)
D = {{(h')^2 + (w')^2, p*w*w'/cos(b)}, {p*w*w'/cos(b), (p*w')^2}}
 
I read the Gott-Goldberg paper again, and the true value seems to be

T = D . transpose(D)

For azimuthal projections, the matrix has eigenvalues and eigenvectors
  • (r')^2 - {cos(p), sin(p)}
  • (r/cos(b))^2 - {-sin(p), cos(p)}

For cylindrical projections, the matrix is
{{(1/cos(b))^2, 0}, {0, (h')^2}}

For pseudocylindrical projections, the matrix is
{{(w/cos(b))^2 + (p*w')^2, p*w'*h'}, {p*w'*h', (h')^2}}

Equal-area: det(T) = constant -> det(D) = constant
Conformal: T = (scalar function) * (identity matrix)

Tissot's indicatrix is customarily graphed as an ellipse with major axes sqrt(the matrix's eigenvalues), axes that point along the matrix's eigenvectors.
 
Back
Top Bottom