• Welcome to the new Internet Infidels Discussion Board, formerly Talk Freethought.

Mapping Vector Fields

SLD

Contributor
Joined
Feb 25, 2001
Messages
5,168
Location
Birmingham, Alabama
Basic Beliefs
Freethinker
When I create a simple vector field in my WolframAlpha App - the free version for iPad, it creates a diagram of vectors which is the usual way that such fields are Expressed. But I find this too confusing. I was looking for an app or website that would show how a map of how the X,y grid is transformed. Or also how other simple equations are transformed, say a parabola or a circle.

So take a simple vector field say (x^2y, y^2,x). how does it transform x,y in one coordinate system to the next. What happens to a unit circle centered around the point (3,4)? Or a simple parabola y=x^2.

I wouldn’t think it would be so hard to make. But google is not helpful.

TIA.

SLD
 
Scilb is a good free tool. It is a good as Mathlab.

A vector field is the direction of force at points in the field. Imagine a ball on a string going around in a circle. At any point on the circle there is a resultantforce vector.

In a fieled plot of a 3d electric field the vectors at points can pout in any 3d direction. The field plot represents the force on an imaginary tiny test charge at points in the field.

Vectors represent magnitude and direction.
 
Last edited:
Scilb is a good free tool. It is a good as Mathlab.

A vector field is the direction of force at points in the field. Imagine a ball on a string going around in a circle. At any point on the circle there is a resultantforce vector.

In a fieled plot of a 3d electric field the vectors at points can pout in any 3d direction. The field plot represents the force on an imaginary tiny test charge at points in the field.

Vectors represent magnitude and direction.

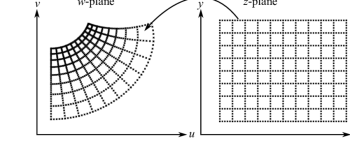
But it should also take a point (x,y) and map it to another point (r,s). I wanted to see what a field did to a square, or the entire grid, or other shapes like a circle.

A static electric field again. The force vector at a point takes into account all the point charges acting on that particular point. The shape of the field does not change the process. The shape or boundary of the field demines the boundary conditions of the differential equations. It also sort of Segways into Gauss's Divergence Theorem.
 
Imagine a piece of wire you can bend into any shape you want.

Put a charge on the wire and do a field map in a box around the wire. The shape of the wire can be a circle, square, triangle, or any 3d shape. The field map will change depending on the shape of the wire figure.
 
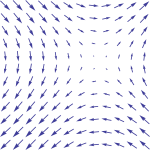
Yes, but there’s two different ways to graphically represent the field. This is what I can do.

2B93EA11-4A1A-4CA6-A925-9027553931C8.png

This is what I want to do:

498E3F2C-08EB-4256-AD8B-7AEEA141C1CB.png

And, yes, I realize that these are different functions
 
Yes, but there’s two different ways to graphically represent the field. This is what I can do.

View attachment 28539

This is what I want to do:

View attachment 28540

And, yes, I realize that these are different functions

Ok. The plots make me dizzy.

You can also do a 2d 3d false color presentation. Color spectrum versus magnitude.
 
Last edited:
Back
Top Bottom