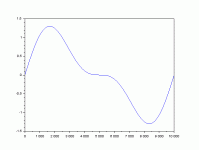
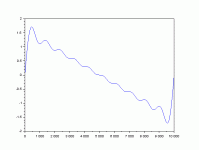
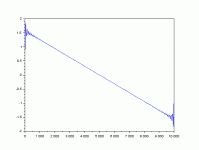
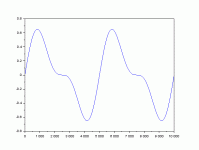
steve_bank
Diabetic retinopathy and poor eyesight. Typos ...
Just when you thought it could not get any more interesting.
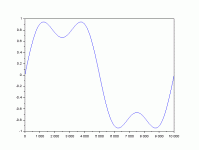
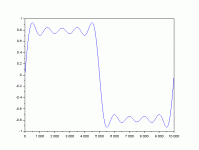
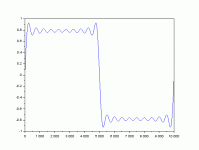
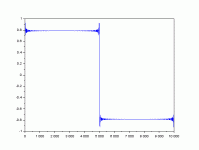
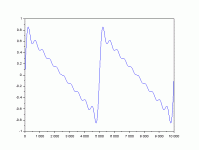
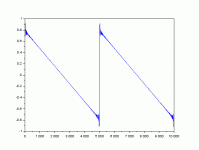
Gibbs phenomenon - Wikipedia
The Gibbs phenomenon was first noticed and analyzed by Henry Wilbraham in an 1848 paper.[5] The paper attracted little attention until 1914 when it was mentioned in Heinrich Burkhardt's review of mathematical analysis in Klein's encyclopedia.[6] In 1898, Albert A. Michelson developed a device that could compute and re-synthesize the Fourier series.[7] A widespread myth says that when the Fourier coefficients for a square wave were input to the machine, the graph would oscillate at the discontinuities, and that because it was a physical device subject to manufacturing flaws, Michelson was convinced that the overshoot was caused by errors in the machine. In fact the graphs produced by the machine were not good enough to exhibit the Gibbs phenomenon clearly, and Michelson may not have noticed it as he made no mention of this effect in his paper (Michelson & Stratton 1898) about his machine or his later letters to Nature.[1] Inspired by some correspondence in Nature between Michelson and Love about the convergence of the Fourier series of the square wave function, in 1898 J. Willard Gibbs published a short note in which he considered what today would be called a sawtooth wave and pointed out the important distinction between the limit of the graphs of the partial sums of the Fourier series, and the graph of the function that is the limit of those partial sums. In his first letter Gibbs failed to notice the Gibbs phenomenon, and the limit that he described for the graphs of the partial sums was inaccurate. In 1899 he published a correction in which he described the overshoot at the point of discontinuity (Nature: April 27, 1899, p. 606). In 1906, Maxime Bôcher gave a detailed mathematical analysis of that overshoot, coining the term "Gibbs phenomenon"[8] and bringing the term into widespread use.[1]
After the existence of Henry Wilbraham's paper became widely known, in 1925 Horatio Scott Carslaw remarked "We may still call this property of Fourier's series (and certain other series) Gibbs's phenomenon; but we must no longer claim that the property was first discovered by Gibbs."[9]

