• Welcome to the new Internet Infidels Discussion Board, formerly Talk Freethought.

The Fourier Trasform

steve_bank

Diabetic retinopathy and poor eyesight. Typos ...
Joined
Nov 9, 2017
Messages
13,834
Location
seattle
Basic Beliefs
secular-skeptic
Transforms.pdf (uncw.edu)
lecture8 (stanford.edu)
Convolution -- from Wolfram MathWorld


As applied mathematics the Fourier Transform is ubiquitous., especially in engineering. Beyond straightforward textbook examples it is applied digitally. Fourier showed that any real function can be decomposed into a sine-cosine series. The basic algorithm is straightforward, a series summation. It involves a lot of multiplications and in the early days of PCs the FT was used as a speed benchmark.

Back then people coded it in GWBASIC. The straight solution is the Discrete Fourier Transform, or DFT. The Fast Fourier Transform or FFT is an optimized solution. You can look at the links and other info on the net.

The Fourier Transform has wide applications and is foundational. Fourier showed that any real function can be decomposed into a sine.-cosine series. Outside of simple textbook problems it is not practical to apply the transform by performing the integral. It is done digitally.

The Discrete Fourier Transform(DFT) was the original algorithm. It involves a lot of multiplications. On early computers it was agonizingly slow. On my first PC without a math coprocessor a 1024 point transform could take a while. The Fast Fourier Transform(FFT) is an optimization of the DFT.

You can look at the links and there are C code implementations on the net. There is no need to clutter the thread with equations. The coding is straightforward. Way back people did it in GWBAsic.

The script is in Scilab but it can be ported to other tools. Excel may have an FFT in an add on. There are numerous C code implementations on the net. Scilab is free if you want to experiment. Scilab can import audio files for speech processing.

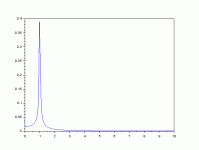
The code generates sine waves and pulses. The spectral analysis of pulses has significance in digital electronics and communications.

To add noise to the sines make the mean and std variables non zero. 0 0 means no noise.

A combination of 2 sines can be created. For a single sine make one amplitude zero.

The pulse function will place a pulse anywhere in the record.

The spectrum from the transform is symmetric, two mirror halves. This means for a sine amplitude of 1 the line amplitude is 0.5.

I did not add phase. To find the phase of a line take the arctan of imag/real of the transform, and determine the quadrant from the imag and real signs.
 
clear //clear variables and graphics
clf(1) ;clf(2);clf(3);clf(4);clf(5)

function p = _pulse(_length, _width, _amplitude, _delay)
for i = 1:_length
p(i) = 0;
if (( i < (_delay + _width)) && (i > _delay) ) p(i) = _amplitude;end;
end
endfunction

function s = _sine(_n, _f1, _f2, _pha1, _pha2 , _am1 , _am2, _m,_sd,_ofs)
_noise = grand(_n,1,"nor",_m,_sd)
for t = 1: _n
s1(t)= _am1 * sin(2*%pi*_f1*(t-1)/(n-1) + _pha1)
s2(t)= _am2 * sin(2*%pi*_f2*(t-1)/(n-1) + _pha2)
s(t) = s1(t) + s2(t) + _noise(t) + _ofs
end
endfunction

n = 1024 // record length
os = 0 // sine dc offset
f1 = 103.5 // sine cycles
f2 = 101
a1 = 1 // sine amplitudes
a2 = 0
p1 = (0/360)*n //sine phase
p2 = (0/360)*n
_mean = 0 // noise mean
_std =0// noise stadard deviation
pulse_amp = 1
pulse_width = 15
pulse_start = 500

//create time domain pulse sine signals
ys = _sine(n,f1,f2,p1,p2, a1, a2, _mean,_std,os)
win = window('hn', n) // re, hn rectabgular Hanning
for i = 1:n ys(i) = ys(i) * win(i);end;
yp = _pulse(n, pulse_width, pulse_amp,pulse_start)
// forward trasforms.
// transform symmetrical, use lower spectrum
// transform is complex magnitude is
tfys = fft(ys,1) // sine wave transform
tfyn = fft(ys,1,"nonsymmetric")// noise plus sines transform
tfyp = fft(yp,1)// pulse transform
for i = 1:n/2; // transform is complex, magnitude is RSS
_mag_ys(i) = abs(tfys(i))
_mag_yp(i) = abs(tfyp(i))
end
// zero out noise lines
for i = 1:n if abs(tfyn(i)) < 0.2 then tfyn(i) = 0;end;end;
//inverse transforms
itfys = fft(tfys,-1)
itfyn = fft(tfyn,-1) // inv trans without the noise
// plots
//ys spectrum
_ysspec = scf(1)
clf(_ysspec)
plot(_mag_ys(1:500))
// ys data
_ysdata = scf(2)
clf(_ysdata)
plot(ys)
// inerse transform ys
_itfys=scf(3)
clf(_itfys)
plot(itfyn )
// pulse data
_ypdata=scf(4)
clf(_ypdata)
plot(yp)
// pulse spectrum
_ypspec=scf(5)
clf(_ypspec)
plot2d3(_mag_yp)
 
The transform is not perfect. There can be sidelobes or skirts around a line that can reduce the ability to detect close frequencies. Oart of it is the finite arithmetic. Another art is the endpoints and rise of amplitude at the endpoints. If the endpoints are not zero or the dat chges rapidly near the endpoints he result is frequncy content fromm the edges. A solution is the use of windows. A window is a curves from 0 to 1 multiplied pont by point with the data. There are a number of windows in usage, there are two in the bode, rectangular and Hanning.

Note the reduction in the sidelobes and reduction in amplitude with the window applied.

sine2w.png

spec2sinew.png
 
Noise is added to a sine wave, the transform id taken, noise lines zeroed out, and the inverse transform taken back to the time domain with a cleaned up signal.

This is also a form of convolution. 'Convolution in the tine domain is multiplication in the frequency domain'.

sinenoise.png

sineclean.png
 
The transform of a pulse is important in th electrical world. The form of the spectrum is sinx/x. For a voltage pulse the spectrum represents electromagnetic radiation. The shorter the pulse the more radiation and radiated interference. As the pulse narrows the frequency content in the pulse goes up. In the limit as the pulse width goes to zero it becomes the theoretical unit impulse. It has use in analysis of linear systems and has the LaPlace transform of 1/s. The unit impulse has an infinite number of frequencies, theoretical of course.


The transform of a pulse is important in th electrical world. The form of the spectrum is sinx/x. For a voltage pulse the spectrum represents electromagnetic radiation. The shorter the pulse the more radiation and radiated interference. As the pulse narrows the frequency content in the pulse goes up. In the limit as the pulse width goes to zero it becomes the theoretical unit impulse. It has use in analysis of linear systems and has the LaPlace transform of 1/s. The unit impulse has an infinite number of frequencies, theoretical of course. Something went wrong exporting to png giving a doublepicture.

View attachment 32886

View attachment 32887


specpulse2.pngspecpulse2.png
 
The last example is amplitude modulation. The spectrum is the carrier with side-bands at +- the modulating frequency.

If we detect a signal from beyond the solar system the first thing we might do us a spectrum analysis. Each form of our electronic communications has a recognizable spectrum.


clear
fc = 250 //carrier freq
fm = 20 // mod freq
ac = 34 // carrier amplitude
mi = .4 // modulation index 0 - 1
n = 1024
w = window("re",n)
noi = grand(n,1,"nor",0,0)
for i = 1:n
y(i) = ac*(1 + mi*cos(2*%pi*fm*(i-1)/(n-1))) * cos(2*%pi*fc*(i-1)/(n-1)) + noi(i)
y(i) = y(i)*w(i)
end
ytf = fft(y,1)
for i = 1:n/2 tfm(i) = abs(ytf(i));end;

yd = scf(1)
clf(1)
plot(y)
yd = scf(2)
clf(2)
plot(tfm)


am1.pngam1.pngam1.png

am2.pngam2.png
 
I find this interesting insofar as one of the applications I work with every day uses this principle to determine side-band tones on an analog signal (converted through an ADC), where the influence on the side and tones is interpreted as a signal strength on a sensor, originating as changes in voltage across a wheatstone bridge.
 
I find this interesting insofar as one of the applications I work with every day uses this principle to determine side-band tones on an analog signal (converted through an ADC), where the influence on the side and tones is interpreted as a signal strength on a sensor, originating as changes in voltage across a wheatstone bridge.

I am aware of FM proportional to a voltage for instrumentation. First time I heard of using AM, but it is simple and elegant.
 
Yeah, it's a pretty cool technology, leveraging the amplitude deltas on voltage on the basis of presence or absence of a paramagnetic bead located against a resistor in a strong magnetic field.
 
Yeah, it's a pretty cool technology, leveraging the amplitude deltas on voltage on the basis of presence or absence of a paramagnetic bead located against a resistor in a strong magnetic field.

Sounds like Hall effect non contact current sensing? Used it on power supplies for isolation.

I appreciate clever solutions.

Adding ..If I were to design it I would use a microcontroller to read the voltage and modulate a direct digital synthesizer chip.

The down conversion an be dome digitally and the microcontroller can do the transform and noise reduction .

Just doodling. Whenever I hear a problem I start thinking on how I would do it.With a processor you could also do single sideband.
 
Last edited:
A version with the proper scaling of time abd frequency. The spectrum for a 1hz signal lines up with 1hz in the plot, and the time domain signal shows a 1 second period.

Looks lke some of he text is interpreted as emoji.

clear

record_length = 2^15
sf = 2000 // sampling ferequency
df = sf/(record_length)
dt = 1/sf
sigf = 1
amp = 1
ph = (2*%pi)*(0/360)

w = window("re",record_length)
// frequency x axis
for i = 1:record_length/2
if (i == 0) f(i) = 0;end;
if (i > 0)f(i) = df * (i-1);end;
end

fmax = f(record_length/2)
// time domain x values for plot
for i = 1:record_length
if( i == 1)t(i)=0;end;
if( i > 1)t(i)= (i-1) * dt;end;
end

for i = 1:record_length
y(i) = w(i)*amp * sin(2*%pi*sigf*t(i) + ph)
end

tf = fft(y,1)
for i = 1: record_length/2 tfm(i) = abs(tf(i));end;
// plot zoom
fl = df // hertz
fh = 10
ps = floor(fl/df)
pe = ceil(fh/df)
y1 = dt // seconds
y2 = 2
ss = floor(y1/dt)
se = ceil(y2/dt)


_y = scf(1)
clf(_y)
plot(t(ss:se),y(ss:se))

_tfm = scf(2)
clf(_tfm)
plot(f(ps:pe),tfm(ps:pe))
 
A version in C of the DFT from the net

{
double pi2 = 2.0 * M_PI;
double angleTerm,cosineA,sineA;
double invs = 1.0 / size;
for(unsigned int y = 0;y < size;y++) {
output_seq[y] = 0;
for(unsigned int x = 0;x < size;x++) {
angleTerm = pi2 * y * x * invs;
cosineA = cos(angleTerm);
sineA = sin(angleTerm);
output_seq[y].real += input_seq[x].real * cosineA - input_seq[x].imag * sineA;
output_seq[y].imag += input_seq[x].real * sineA + input_seq[x].imag * cosineA;
}
output_seq[y] *= invs;
}
 
Yeah, it's a pretty cool technology, leveraging the amplitude deltas on voltage on the basis of presence or absence of a paramagnetic bead located against a resistor in a strong magnetic field.

Sounds like Hall effect non contact current sensing? Used it on power supplies for isolation.

I appreciate clever solutions.

Adding ..If I were to design it I would use a microcontroller to read the voltage and modulate a direct digital synthesizer chip.

The down conversion an be dome digitally and the microcontroller can do the transform and noise reduction .

Just doodling. Whenever I hear a problem I start thinking on how I would do it.With a processor you could also do single sideband.

So, actually detailing the mechanism of the transform is getting into proprietary weeds.

It is actually an effect called Giant Magneto-Resistance, though whether that leverages Hall effects is beyond me:

They physics I know of it involve the principle wherein the stronger a magnetic field that a particular variety of resistor is in, the more resistive it becomes. So by adding paramagnetic materials in close proximity to the resistor and swinging around the strength of the field on a Sine wave, we can detect how much the resistor normally resists, and then how much it resists when the coil field exceeds the paramagnetic bead's ability to randomize it's own particle spin via heat: thus the bigger field induces magnetism in the bead and this impacts the total resistance measurably.

It is good to talk shop again.
 
You may wonder why spectral analysis is such a big deal.

Mechanical and electrical structures respond differently to different frequencies. A very narrow pule be it electrical or mechanical has a high spectra content.

A project described in a 60s book bt Tookey. There was a need to determine the spectral content io ocean waves relative to a structure in the water. Float sensors measured the wave amplitudes and the FFT determined the spectrum.
 
Discrete Wavelet Transforms

The time series of a signal < f(t0), f(t1), f(t2), ... > tells you about the temporal domain. ("Time" isn't key — replace it with "position" for images.)

But the time series tells you nothing directly about the signal in the frequency domain; for that you find its Fourier series. But this gives the opposite "problem" — if all you have are those Fourier coefficients you know nothing directly about the temporal domain until you invert the series back.

Enter the wavelet transform(s)! These provide information about both the temporal and frequency domains. I once worked with a slightly famous Professor who explained a relationship to the Heisenberg Uncertainty Principle! Know the exact local signal temporally and know nothing about its frequency. Or vice versa, if you switch to Fourier domain. Wavelets offer a compromise, with the product of uncertainties in temporal and frequency domains bounded by a constant, a la Planck's constant in physics!

For a while I worked with such transforms and their application to signal compression. (I even have a few patents in the field.) A common complaint was that wavelets could be designed to be non-trivial OR orthogonal OR symmetric, but it was impossible to achieve all three. Non-orthogonal transforms were used, seemingly out of necessity. But one day I learned an interesting (little known?) fact.

For block transforms there is a theorem that the maximal energy compaction is achieved with an orthogonal transform. For example, this is where Jpeg's DCT comes from: it is the (asymptote of) the  Karhunen–Loève transform of a simple Markov signal model; and like all KLTs, is orthogonal. BUT this theorem does NOT apply with overlapping constraints, e.g. with the wavelets used in JPEG2000. I see a Wiki article  Biorthogonal wavelet that speaks of extra freedoms gained when orthogonality is sacrificed, but it does not explicitly mention that they can achieve better energy compaction.

The capability for better energy compaction is a simple algebraic fact, but I think it can be understood intuitively by examining the analysis and synthesis low-pass filters. I Googled to find a good image of this for wavelets but none appeared. :( Rather than building my own waveform images for presentation here, I'll just show the approximate filter taps. (These filters have been scaled and rounded arbitrarily to give them integer values and approximately equal energy.)

JPEG Analysis: (0, +61, +61, +61, +61, +61, +61, +61)
JPEG Synthesis: (0, +61, +61, +61, +61, +61, +61, +61)

J2000 Analysis: (-6, -4, -19, +64, +145, +64, -19, -4, -6)
J2000 Synthesis: (0, -11, -7, +73, +138, +73, -7, -11, 0)

As you see, the old JPEG uses simple square waves for its low-pass filters: this causes "blocky" defects. The analysis and synthesis filters are identical, as is the case for all orthogonal transforms. (These filters appear to be much "broader" than the J2000 filters: the latter will be recursed in JPEG2000, but this is beyond the scope of my brief remarks here. Make JPEG's filters 2-tap <123, 123> to "compare apples with apples.")

For JPEG2000 the filters taper off, avoiding blocky defects. Being non-orthogonal, the analysis and synthesis are different: The analysis has bigger (more negative) side-lobes. What intrigued me is that one can intuit the superiority of this non-orthogonality! The bigger side-lobes provide crisper analysis. The smaller side-lobes provide smoother synthesis.
 
Back
Top Bottom