• Welcome to the new Internet Infidels Discussion Board, formerly Talk Freethought.

Older children in the USA now more likely to die than toddlers

bilby

Fair dinkum thinkum
Joined
Mar 6, 2007
Messages
35,754
Location
The Sunshine State: The one with Crocs, not Gators
Gender
He/Him
Basic Beliefs
Strong Atheist
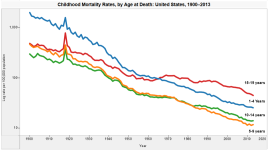
I found this graph:

child-mortality-rates.png

...which was a part of a (rather good and well worth reading) article about the Appeal to Nature Fallacy at https://thelogicofscience.com/2016/04/12/dying-the-way-that-nature-intended-appeal-to-nature-fallacies/.

However two things jumped out at me about the graph that are not discussed in the article.

The first, and perhaps most noticeable, is the 'spike' in deaths caused by the post WWI 'Spanish' Influenza pandemic.

But the second thing to strike me was that the relations between the four cohorts changes quite noticeably from the 1960s to the 1970s, and the new relationship then persists to the present day.

Before the mid-1960s, the 1-4 year-olds were at greatest risk of death, with the 5-9 and 10-14 year-old cohorts tracking close to each other, and the trend for all four cohorts is strongly downward (note the Y-Axis is a logarithmic scale). But then in the 1950s the death rate for the 15-19 year-olds flattens out, and then actually increases into the mid 1970s, before returning to its downward trend (but never recovering the 'lost ground' against the younger cohorts.

My best guess is that this, in large part, represents the introduction of the automobile, which became accessible to more and more children in the 15-19 year-old range through the 1950s, '60s, and '70s. But what surprises me is that the excess in deaths in that age group doesn't seem to have dropped back in the period from the '80s to the present - despite the massive improvements in automobile safety in that period. I understand that teen-aged drivers get in a lot more crashes than adults (and obviously there are FAR more drivers in the 15-19 group than in the 10-14s); but I was also under the impression that the majority of such crashes are no longer likely to be fatal.

Does anyone have any good data on this? Is my guess about this cause for 15-19 year-old mortality correct? Is the continuation of this excess of deaths above the general child mortality rate understood? And if it is due to automobile crashes, why is the effect of modern safety systems not apparent?

There seems to be a slight increase in the 10-14 year-old mortality relative to the 5-9 year-olds, starting in about the 1970s and continuing to the present; is there another major cause of death affecting teenagers (ie both 10-14 year-olds and 15-19 year-olds, but not younger children) in that period?
 
You have to take into account that number of teenage drivers has not been a constant.
Death rate is a product of that number and car safety, plus other factors.
 
Also with the inclusion of 18-19 year olds, will that include those that died in Vietnam? In addition, as cars became safer, guns became more accessible. Again, these are all possibilities - but would be interesting to explore. Why did 10-14 increase (cross 5-9)? Guns perhaps?
 
I blame the availability of drugs, post-1960's. With prohibition driving the consumer underground, the inevitable harm of a black market might have started showing up around this time..
 
Looking at the time line, I would hazard a guess that increased drug use as well as increase use of alcohol in teens would account for the increase in deaths in that age group.

The advent of childhood vaccinations and better nutrition has been responsible for the dramatic decrease in childhood deaths. So have increased safety standards and a trend away from childhood commercial and farm labor practices.

Children 1-4 have always been more susceptible to illnesses as it is during those years they have ceased breast feeding and no longer are benefiting from the maternal antibodies gained from breast milk. These are not all compensated for by childhood immunization schedules. They are also just establishing themselves as separate, autonomous individuals and are not necessarily under the watchful eye of a parent 24/7. Also, these children are especially vulnerable to whatever fallout from parental use of drugs and/or alcohol. They are not generally yet in school and so there are no outside adults who might notice something amiss and intervene. Parents are also typically somewhat isolated. They often lack social contacts that can help get them aid when they are struggling, provide community resources that help shore up or supplement or even just provide some basic good parenting skills. Children in that age are also moving from nutritrional programs such as WIC and if not in school, may not yet be connected to nutrition programs present in most public schools. Inadequate nutrition makes children more vulnerable to disease.
 
I blame the availability of drugs, post-1960's. With prohibition driving the consumer underground, the inevitable harm of a black market might have started showing up around this time..

When was  Reefer madness made? Ah yes, 1936, a mere few years after prohibition was de-amendended. Nothing special about seventies. I was a parent then. In cities in the fifties a standard joke was the availability of speed and the like to kiddies in their parent's medicine cabinets.

Just sayin'
 
Dunno but the variations in the 5-9 year olds and the 10-14 year olds seem to track fairly closely and the differences could just be some minor social change.

The other two age groups seem to have only one significant change each that would account for the dramatic looking trend lines. The mortality rate of the 1-4 year old group shows a change in slope between 1940 and 1950 then returns to the same general slope. I don't have a clue what would explain this. The mortality rate of the 15-19 year old group shows an increasing slope between 1965 and 1970 (the Vietnam era) then almost returns to the prior decreasing mortality rate but not quite.

Could 17 to 19 year olds dying in Vietnam account for increasing mortality rate of the 15-19 year old group during that 1965 to 1970 period?

Other than that, if a best fit straight line is drawn for each of these two age groups then it is obvious that the trend lines have different slopes. I would imagine that this is only indicating that we are making more headway in reducing childhood illnesses and accidents than we are at devising methods to protect teenagers from their normal teenage risky behavior.
 
Last edited:
Dunno but the variations in the 5-9 year olds and the 10-14 year olds seem to track fairly closely and the differences could just be some minor social change.

The other two age groups seem to have only one significant change each that would account for the dramatic looking trend lines. The mortality rate of the 1-4 year old group shows a change in slope between 1940 and 1950 then returns to the same general slope. I don't have a clue what would explain this. The mortality rate of the 15-19 year old group shows an increasing slope between 1965 and 1970 (the Vietnam era) then almost returns to the prior decreasing mortality rate but not quite.

Could 17 to 19 year olds dying in Vietnam account for increasing mortality rate of the 15-19 year old group during that 1965 to 1970 period?

I believe the ongoing process in the populations from white northern persons to brown semitropical persons in the US is moving the boundary between preadolescence and adolescence downward. Such would increase the proportion of of ten to fourteens dying in the direction of 15 to nineteen.
 
I blame the availability of drugs, post-1960's. With prohibition driving the consumer underground, the inevitable harm of a black market might have started showing up around this time..

Yeah, that was my first thought in looking at that--criminals dying in the drug war.
 
I blame the availability of drugs, post-1960's. With prohibition driving the consumer underground, the inevitable harm of a black market might have started showing up around this time..

Yeah, that was my first thought in looking at that--criminals dying in the drug war.

Or you might consider the effects of population explosion dating from the end of WWII and later from the onset of the green generation.

Ever wonder why crime was down from the Clinton era to the end of the Bush era? Ever consider looking at demographics?

Just sayin'

Oh, and there's that leaded gasoline thingie ....
 
Dunno but the variations in the 5-9 year olds and the 10-14 year olds seem to track fairly closely and the differences could just be some minor social change.

The other two age groups seem to have only one significant change each that would account for the dramatic looking trend lines. The mortality rate of the 1-4 year old group shows a change in slope between 1940 and 1950 then returns to the same general slope. I don't have a clue what would explain this. The mortality rate of the 15-19 year old group shows an increasing slope between 1965 and 1970 (the Vietnam era) then almost returns to the prior decreasing mortality rate but not quite.

Could 17 to 19 year olds dying in Vietnam account for increasing mortality rate of the 15-19 year old group during that 1965 to 1970 period?

Other than that, if a best fit straight line is drawn for each of these two age groups then it is obvious that the trend lines have different slopes. I would imagine that this is only indicating that we are making more headway in reducing childhood illnesses and accidents than we are at devising methods to protect teenagers from their normal teenage risky behavior.

Interesting; There is indeed a marked change of slope for the 1-4s in the 40s and 50s - I wonder if that has to do with the introduction of antibiotics?

Don't forget the massive development of vaccines in the 40s and 50s.
 
Yeah, that was my first thought in looking at that--criminals dying in the drug war.

Or you might consider the effects of population explosion dating from the end of WWII and later from the onset of the green generation.

Ever wonder why crime was down from the Clinton era to the end of the Bush era? Ever consider looking at demographics?

Just sayin'

Oh, and there's that leaded gasoline thingie ....

Population boom & bust doesn't change the % of people who commit crimes. The demographic-adjusted crime rate is still way below what it used to be.
 
Also with the inclusion of 18-19 year olds, will that include those that died in Vietnam? In addition, as cars became safer, guns became more accessible. Again, these are all possibilities - but would be interesting to explore. Why did 10-14 increase (cross 5-9)? Guns perhaps?
That would be stupid to include deaths in the war into that statistics. And if you look into the graph you will see that increase persisted well into end of seventies-eighties when war was over.
It really depends on how you draw your "best fit" straight line. It could be looked at as there is an unexplained decrease in death rate between the early 1940s and the late 1960s.
 
Back
Top Bottom