• Welcome to the new Internet Infidels Discussion Board, formerly Talk Freethought.

Iowa Caucuses (or Cauci?)

All?

Iowa Caucus Results Riddled With Errors and Inconsistencies - The New York Times


The counts are made by volunteer staff. This is the first year they have released all this data other than SDEs. The past caucuses may would have numerous errors as well if they were looked at as closely as they are this time.

Here's a breakdown of all the errors, and a visualization of how they are distributed (from Twitter):

I put together a spreadsheet of all precinct issues I (and others) have identified. Currently there are 28 precincts w/ Delegate allocation errors.

The impact of correcting them would be +3.954 SDEs for Bernie. More than enough to overtake Pete.

View attachment 26030

Does that look random to you?

It does not look random. Caveats:
1. This assumes trusting the data which I do not currently.
2. I would rather do a regularly recognized type of test, such as a t-test. Do you have a set of data for Buttigieg and Sanders, like a list of numbers for each one? Something like B={-3,-3,-3,-2,-2,-2,-1,0,1}; S={-2,-2,-1,0,1,1,1,1,1,2,2,2,2,2,3} or whatever. Then, I can see if it is statistically significant or not.

That still won't tell me if the data posted to the Internet is reliable, but it would be half-way there for me. I would then need to try to reproduce the data. (point#1 above)
 
Here's a breakdown of all the errors, and a visualization of how they are distributed (from Twitter):


View attachment 26030

Does that look random to you?

It does not look random. Caveats:
1. This assumes trusting the data which I do not currently.
2. I would rather do a regularly recognized type of test, such as a t-test. Do you have a set of data for Buttigieg and Sanders, like a list of numbers for each one? Something like B={-3,-3,-3,-2,-2,-2,-1,0,1}; S={-2,-2,-1,0,1,1,1,1,1,2,2,2,2,2,3} or whatever. Then, I can see if it is statistically significant or not.

That still won't tell me if the data posted to the Internet is reliable, but it would be half-way there for me. I would then need to try to reproduce the data. (point#1 above)
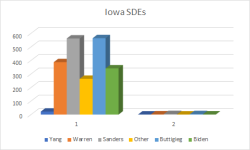
The accumulated error is < 0.5%. The scale being used is intended to mislead the reader. There is nothing to see here.
 
Here's a breakdown of all the errors, and a visualization of how they are distributed (from Twitter):


View attachment 26030

Does that look random to you?

It does not look random. Caveats:
1. This assumes trusting the data which I do not currently.
2. I would rather do a regularly recognized type of test, such as a t-test. Do you have a set of data for Buttigieg and Sanders, like a list of numbers for each one? Something like B={-3,-3,-3,-2,-2,-2,-1,0,1}; S={-2,-2,-1,0,1,1,1,1,1,2,2,2,2,2,3} or whatever. Then, I can see if it is statistically significant or not.

That still won't tell me if the data posted to the Internet is reliable, but it would be half-way there for me. I would then need to try to reproduce the data. (point#1 above)
The accumulated error is < 0.5%. The scale being used is intended to mislead the reader. There is nothing to see here.

What difference does it make if the error is < .5%? The results between Sanders and Buttigieg were different by 0.15%.* So such an error can impact the end result.

Am I misunderstanding you?

*this was before all data was released. I think the difference is even less now.
 
The accumulated error is < 0.5%. The scale being used is intended to mislead the reader. There is nothing to see here.

What difference does it make if the error is < .5%?
It means it is statistical noise.
The results between Sanders and Buttigieg were different by 0.15%. So such an error can impact the end result.
Which should be corrected, but if the errors are so small, to suggest it is intentional is ridiculous, especially in seeing that the change in the delegate count won't change much at all.

There is way too much emphasis being put on "who won Iowa". It is like asking who won the London Marathon after 800 feet had been run. 1900 delegates are needed, Iowa is a tiny piece of that pie. Iowa needs to clean up the results, but that chart which was included is grossfully misleading.
 
It means it is statistical noise.

Does it? On what mathematical grounds?

Jimmy Higgins said:
The results between Sanders and Buttigieg were different by 0.15%. So such an error can impact the end result.
Which should be corrected, but if the errors are so small, to suggest it is intentional is ridiculous, especially in seeing that the change in the delegate count won't change much at all.

There is way too much emphasis being put on "who won Iowa". It is like asking who won the London Marathon after 800 feet had been run. 1900 delegates are needed, Iowa is a tiny piece of that pie. Iowa needs to clean up the results, but that chart which was included is grossfully misleading.

How is it misleading? Saying the error is .5% doesn't mean it's misleading to me because it clearly states it is showing the errors.

I will add that the claim from the mainstream press is that the "errors are unbiased." The visualization seems to indicate this claim is false and it is doing so by showing the error distributions. I'd like to know if the news source was dishonest.
 
Does it? On what mathematical grounds?
Unless proven otherwise, I think the "it is a conspiracy" crowd need to pick up the ball and demonstrate it.

Jimmy Higgins said:
Which should be corrected, but if the errors are so small, to suggest it is intentional is ridiculous, especially in seeing that the change in the delegate count won't change much at all.

There is way too much emphasis being put on "who won Iowa". It is like asking who won the London Marathon after 800 feet had been run. 1900 delegates are needed, Iowa is a tiny piece of that pie. Iowa needs to clean up the results, but that chart which was included is grossfully misleading.

How is it misleading?
It is implying a more significant error than actually exists.
Saying the error is .5% doesn't mean it's misleading to me because it clearly states it is showing the errors.

I will add that the claim from the mainstream press is that the "errors are unbiased." The visualization seems to indicate this claim is false and it is doing so by showing the error distributions. I'd like to know if the news source was dishonest.
From PH's chart 11 counties err'd against Sanders, 4 err'd for him. Vica Versa for Buttigieg. The error in Buttigieg's favor in 8 of those counties amounted in sum... to 1 SDE... which appears to be the equivalent of a centimeter in a race measured in meters. If one fixes Scott County, this really becomes nothing to talk about.
 
Noise. Left chart are awarded SDEs, right chart is the noted error.

View attachment 26031

The claim is that the error is unbiased. This graph is inappropriate and misleading to look at that question. Sorry.
The chart's aim was to indicate the error is generally irrelevant. It was not created to indicate if there was bias in the error. The Caucus was to determine the number of delegates each candidate received, it is not a win all / take all, where a hair width difference does become relevant. This isn't Florida in 2000. Also, what is with the attitude?

This would be one of the worst conspiracies to fix an election ever. It'd be even worse than when the FBI tried to collude with Ukraine to stop Trump from getting elected, but forgetting to do that second part.
 
All?

Iowa Caucus Results Riddled With Errors and Inconsistencies - The New York Times


The counts are made by volunteer staff. This is the first year they have released all this data other than SDEs. The past caucuses may would have numerous errors as well if they were looked at as closely as they are this time.

Here's a breakdown of all the errors, and a visualization of how they are distributed (from Twitter):

I put together a spreadsheet of all precinct issues I (and others) have identified. Currently there are 28 precincts w/ Delegate allocation errors.

The impact of correcting them would be +3.954 SDEs for Bernie. More than enough to overtake Pete.

View attachment 26030

Does that look random to you?

You'd have to be a fool to take something, unsubstantiated, from some unknown tool on twitter. Where are the sources?
 
Here's a breakdown of all the errors, and a visualization of how they are distributed (from Twitter):
Does that look random to you?

You'd have to be a fool to take something, unsubstantiated, from some unknown tool on twitter. Where are the sources?
I have no reason to doubt the data because the data doesn't demonstrate much of what they wanted it to be. You remove one county there and the errors shrink drastically. Errors which are already wire thin.

You're committing a fallacy repeatedly here. I never the said the contested results showed enough variance to change the SDE totals by enough to sway the primary results. That's a matter of how many delegates each candidate gets, and varies continuously in a spectrum, so magnitude of difference would matter if that was the claim. But I'm saying the only thing that actually matters in Iowa is who people believe won. That's binary, and doesn't become more or less of a reality based on the magnitude of the difference. If the goal of this whole debacle was to stall Bernie out of the gate by robbing him of the momentum that would come from being definitively victorious, all that would be needed is a tiny number of delegates ignored or reallocated, not enough to raise too much suspicion. Just some immigrant and religious minorities who can't raise a stink about being left out of the tally as easy as white wine moms, after all. The outcome is that someone other than Bernie is now claiming to have won on CNN, despite getting 6000 fewer votes, and the nation is so confused by everything that half of them believe him.

No, you said this:
Does that look random to you?
which is worse. You implied there is deliberate interference.
 
So, like that congressperson, you are a conspiracy theorist.

Did you even read the Mueller report? Someone's head would have to be shoved pretty far up their ass to not think that Russia would do exactly what we've caught them doing in the past, especially after it worked.

So like an abusive domestic partner, are you gaslighting?

Well, we've got a pattern here. Every time the Democratic Party tries to rig the game and has it backfire, it was the Russians who actually did it. Anyone who doesn't believe the Russians did it is either a conspiracy theorist, a gas lighter, or a Trump supporter.

Maybe, just maybe, the Democratic party tried to rig the game and it backfired.
 
Back
Top Bottom