I started reading the blog linked in the op.
I am not completely convinced by their argument. I actually do think auto-correlation is a little bit of an issue, but not as much as they make it out. More on that...
Essentially, they are saying, "Look, if we throw random numbers in, we can replicate D-K."
So, first, the point of observation of the D-K effect is that persons who are in the lower bracket(s) are very unreliable about their own knowledge. The opposite of D-K, i.e. trying to disprove D-K, would entail not simply choosing random numbers for x and y, but instead having the lower bracket choose random error within some reasonable boundary about x vs x. Then, see what it looks like. If you are choosing random numbers for x and y, then essentially, you are building in SOME of the stupidity of the population. Then, you are saying, "look, when the population is stupid, it looks like a D-K graph. So, the D-K graph must be wrong!!11" which is just a half-contradictory claim.
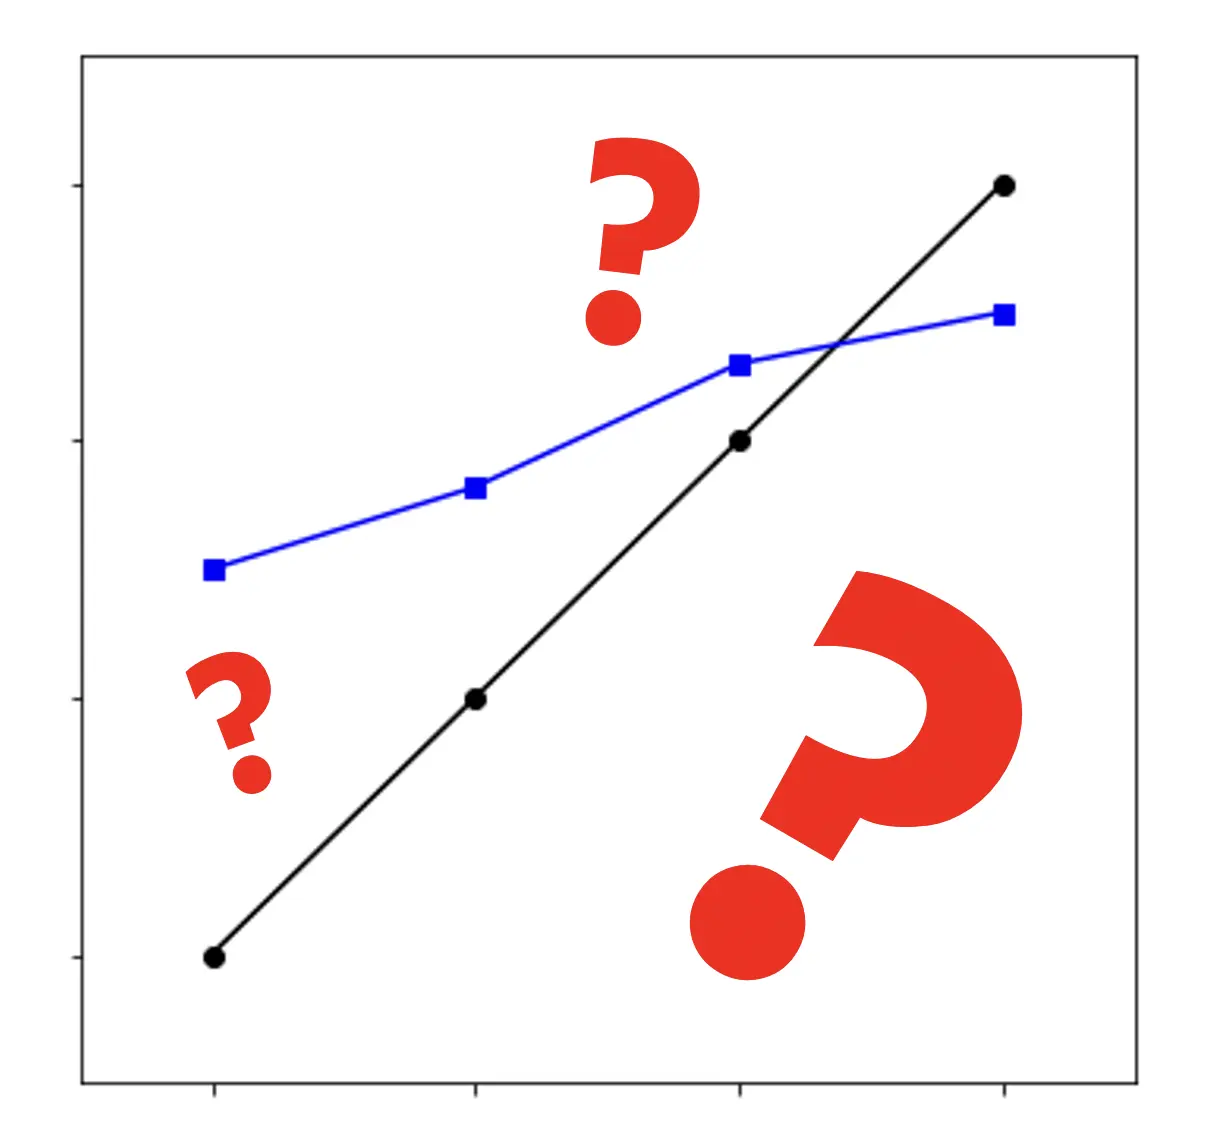
Second, the simulated graph doesn't quite look like the D-K graph. This is because the error between actual and predicted is symmetric in their result which they claim replicates D-K but it does not quite do so, i.e. they present the same magnitude error whether it's for the lower brackets or upper brackets:
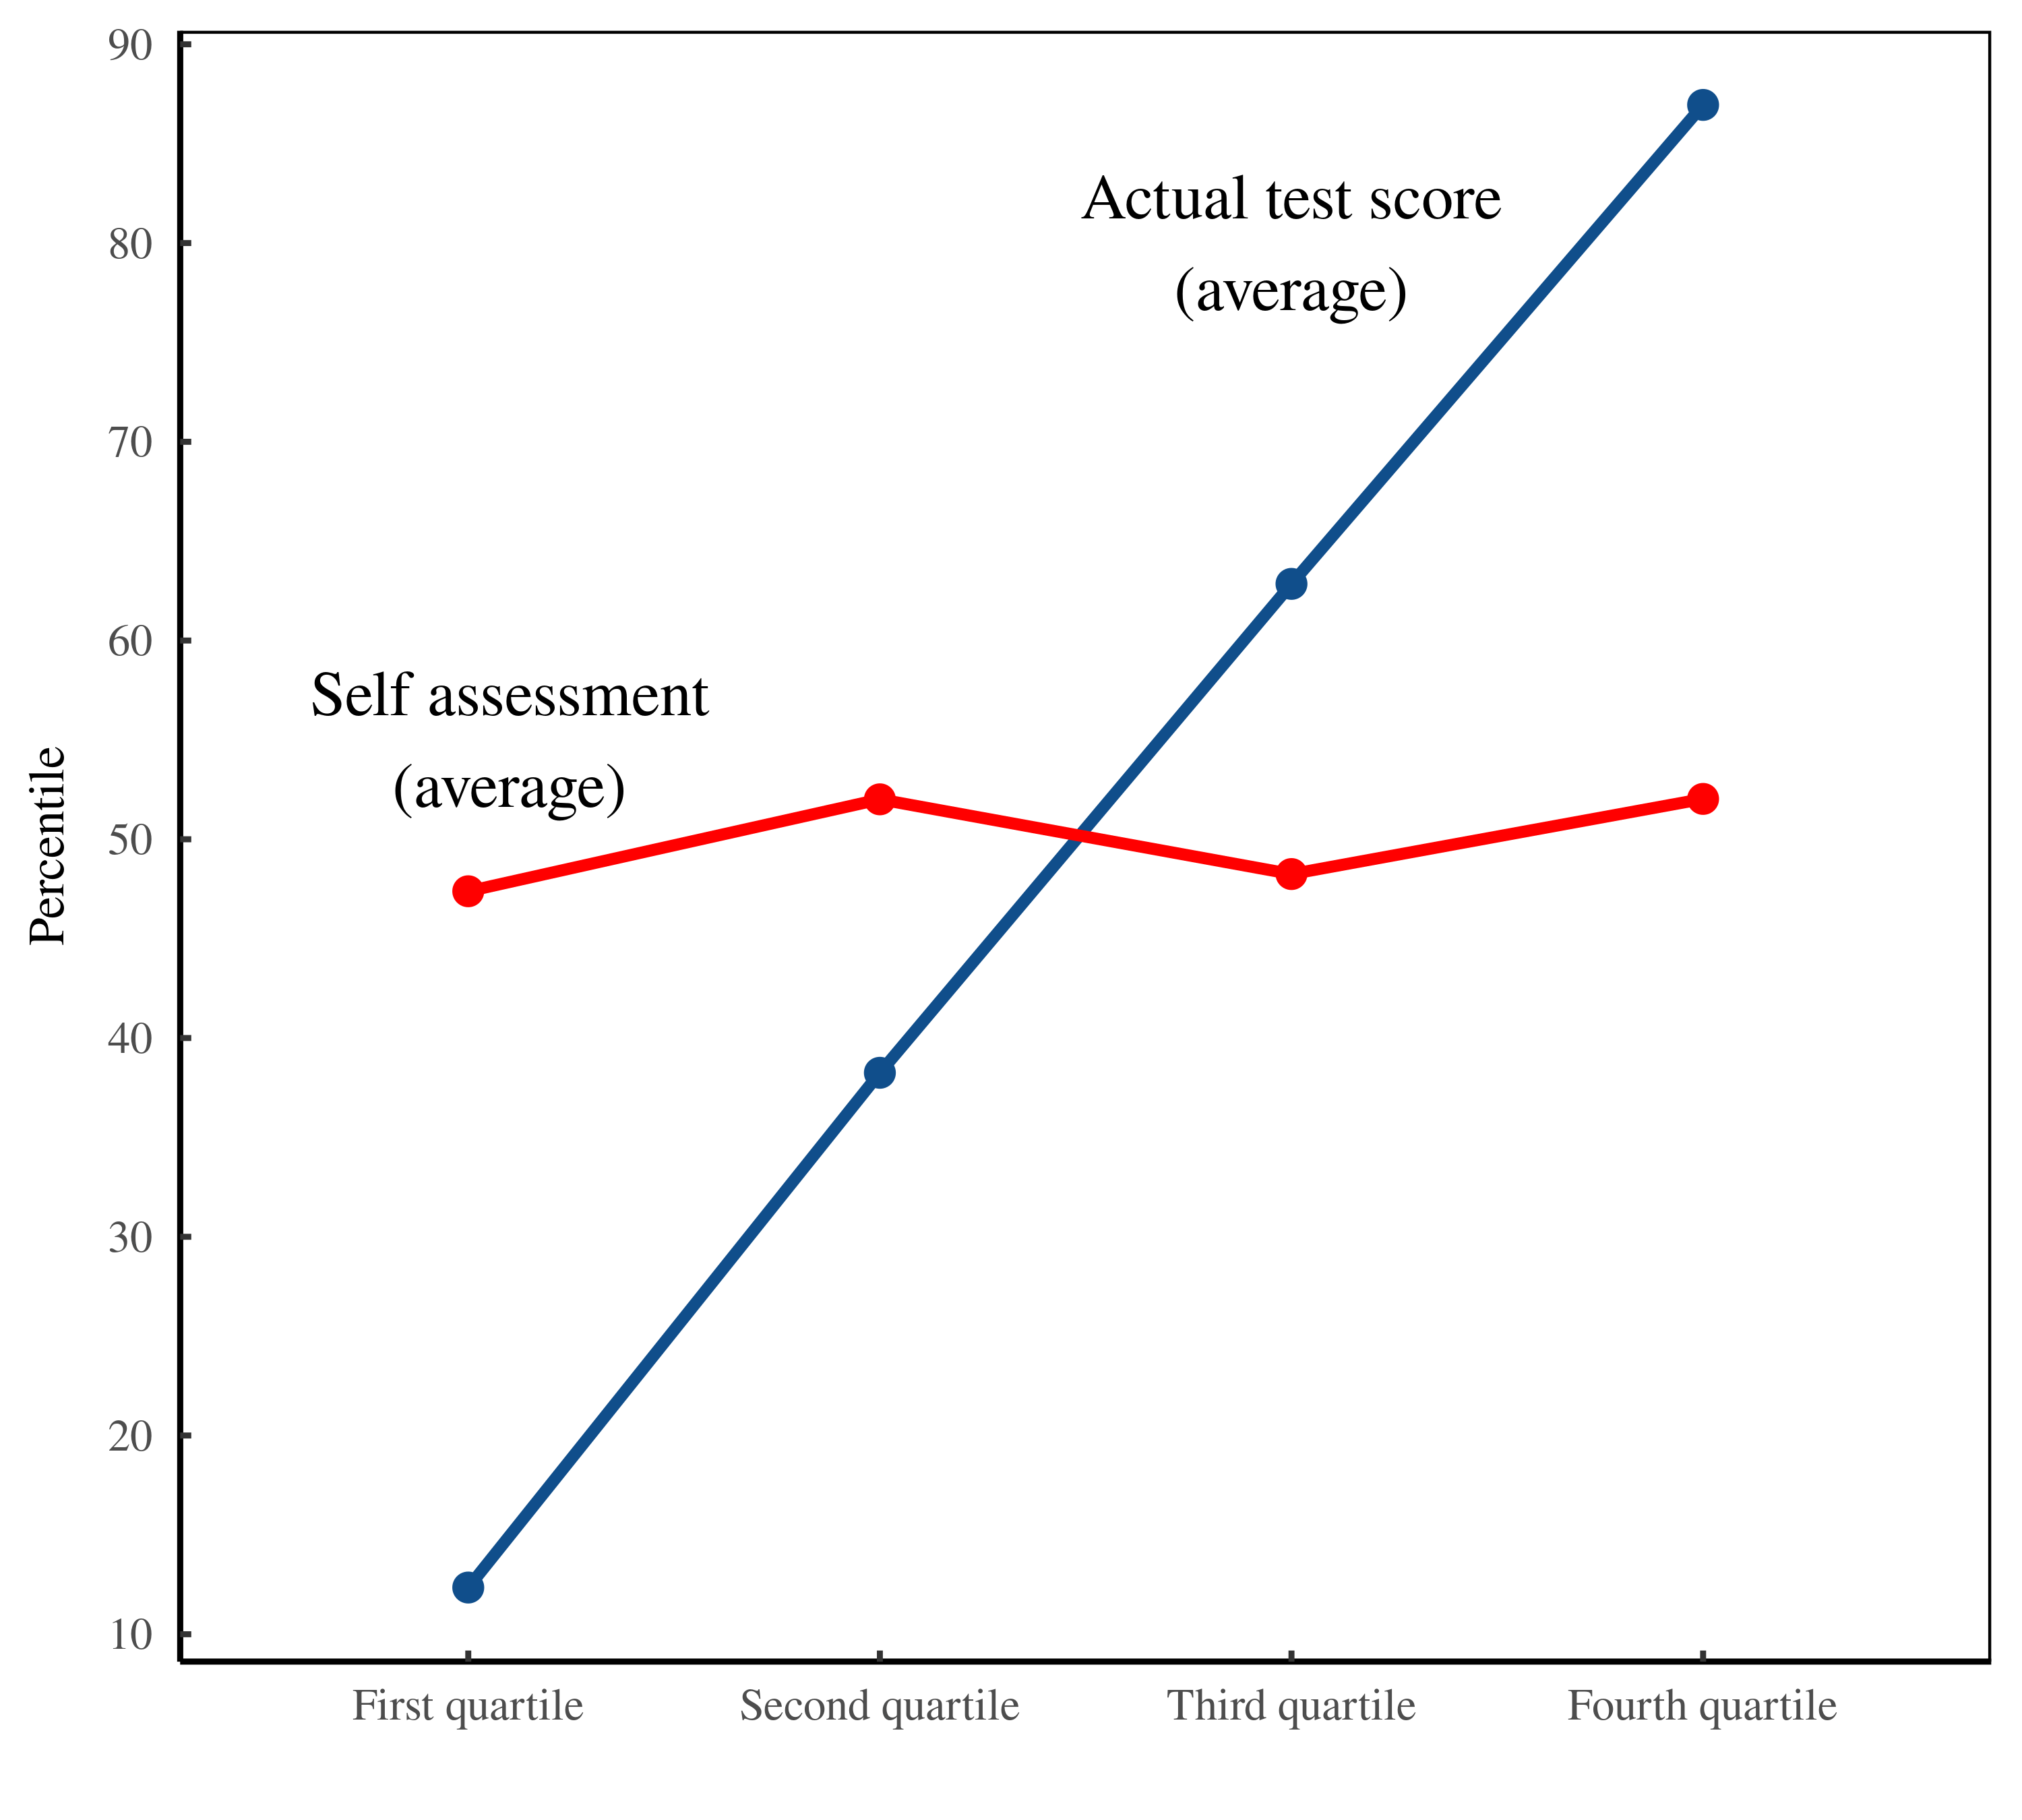
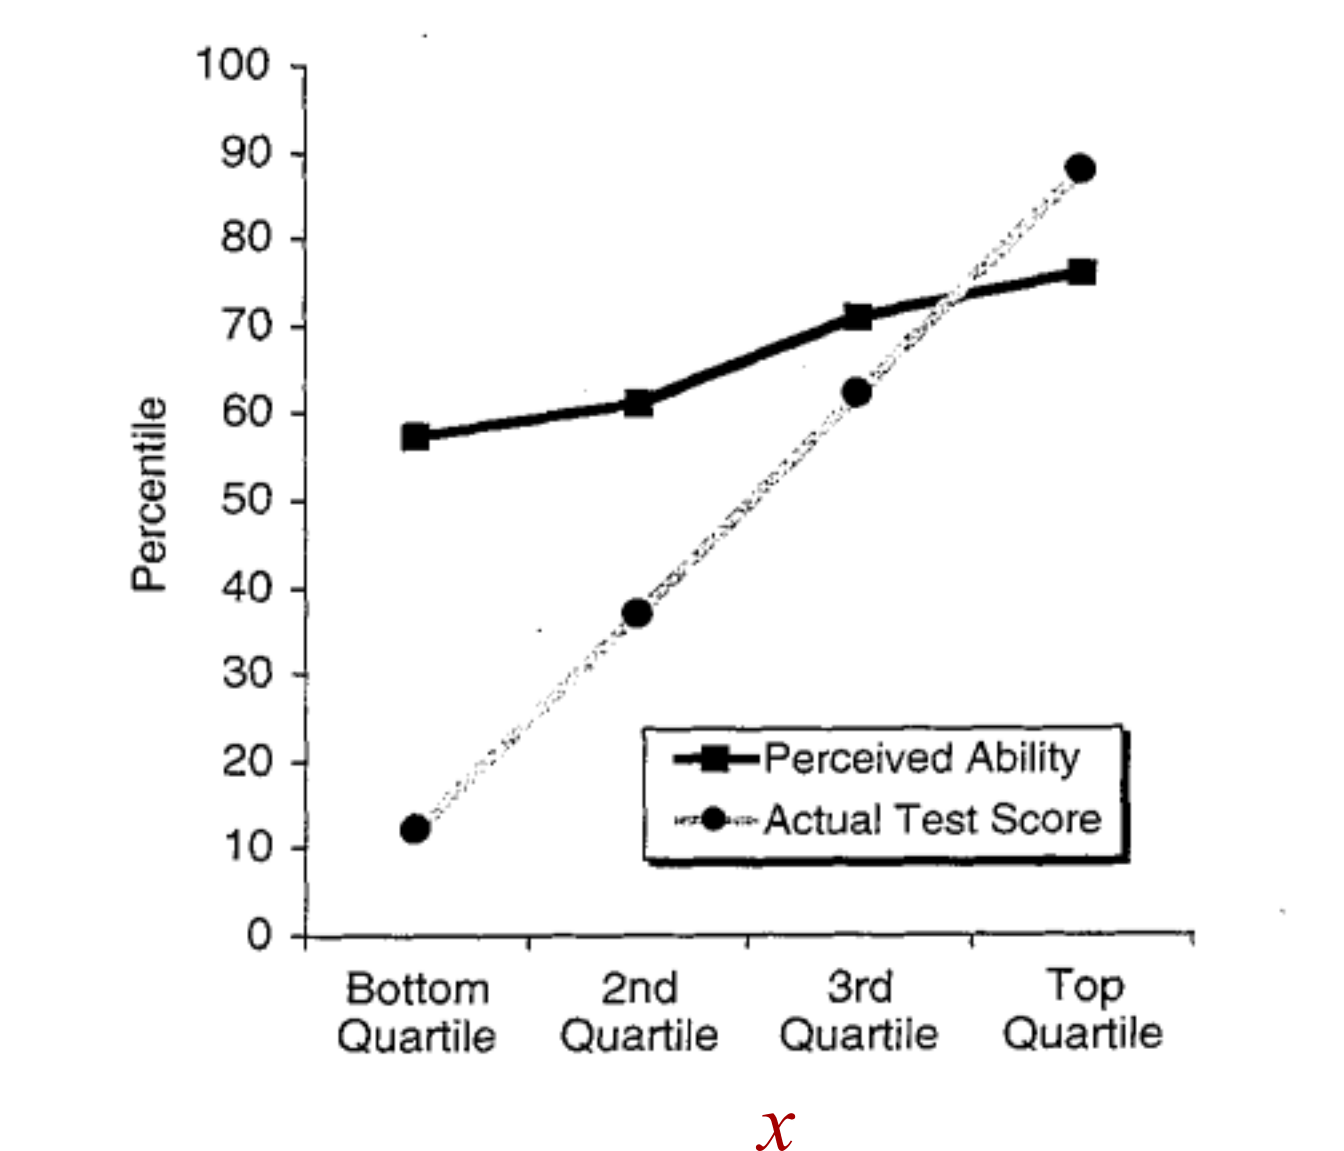
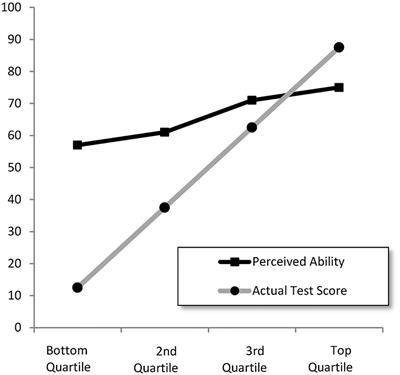
But the D-K graph has a much larger error in the lower bracket and a smaller error in the upper bracket.
D-K observation was that there was much more positive error in lower brackets and smaller negative error in the upper bracket:
Which brings me to the third point of interest. Take a look at user comment#3 in the blog:
The conversion to percentiles introduces a second bias (in addition to the problem of autocorrelation). By definition, percentiles have a floor (0) and a ceiling (100), and are uniformly distributed between these bounds. If you are close the floor, it is impossible for you to underestimate your rank. Therefore, the ‘unskilled’ will appear overconfident. And if you are close to the ceiling, you cannot overestimate your rank. Therefore, the ‘skilled’ will appear too modest. See Nuhfer et al (2016) for more details.
I think this comment needs some tweaking. Suppose there is some unreliability or error about the true line so that a self-assessment is like <= +/- error, say, +/- 10, for example. When an individual has 100%, they can't overestimate their score. When an individual has 99%, they can only overestimate by 1% but there is far more room below, to go down to 89%. Consider the flip side of this observation as well. When an individual is 0%, they can't underestimate. When they are at 1%, there is a lot of room above to overestimate their ability. I am unsure that this creates a "bias" or that "the 'skilled' will appear too modest," as opposed to an alternate hypothesis that actual individuals WILL BE too modest.
In other words, we can talk about this as some kind of theoretical methodological flaw. But on the other hand, when you consider the real, natural world and social phenomena, there really is a cutoff of overestimation in elite individuals and a cutoff of underestimation in sub-par individuals.
In the world of pure math, it's a numerical artifact, but in the natural world, it may be a valid series of observations.

economicsfromthetopdown.com