• Welcome to the new Internet Infidels Discussion Board, formerly Talk Freethought.

The Race For 2024

To condemn Netanyahu's atrocities is to be lumped with Islamist terrorists -- do I have that right? IDS (Ilkish Derangement Syndrome) is strong among some of us here.

- - - - - - - - - - - - - - -

We can often tell whether someone is a seeker of knowledge, or just a propagandist by looking at the graphs they present.

107385780-1710185209142-N2ySn-cumulative-inflation-in-the-u-s-since-january-2021_1.png
By starting the graph at January 1, 2021 whoever prepared this graph sought only to confuse. Gee, with prices rising on January 1, do you think maybe prices were already on an upward trend the day before, December 31?

In fact, the inflation rate began falling about 16 months ago and is now lower than it was during the Nixon, Reagan, or Bush-41 Administrations. This would be easier to see if the y-axis were logarithmic. Compounded rates should almost always be depicted with log scale, as any graph preparer would know provided that he or she is intelligent and interested in advancing knowledge rather than propaganda. Even better than a log y-axis would be to show the year-over-year inflation rate. In fact, until Derec posted the above graph I recall seeing compounded inflation graphed like this only in the YouTubes prepared by gold marketeers or "Libertarians." The DATA for this graph may have come from U.S. BLS but the presentation was obviously purely political propaganda.


As are the higher interest rates made necessary in order to bring the inflation down.
The 30-year fixed-rate average mortgage interest is now about as low as it EVER was throughout the 20th century, as are 10-year Treasuries. High real interest rates are a sign of a HEALTHY economy: The very low interest rates imposed after Bush-43's first recession, Bush-43's 2nd and "great" recession and the Covid pandemic are aberrations.
 
To condemn Netanyahu's atrocities is to be lumped with Islamist terrorists -- do I have that right? IDS (Ilkish Derangement Syndrome) is strong among some of us here.

- - - - - - - - - - - - - - -

We can often tell whether someone is a seeker of knowledge, or just a propagandist by looking at the graphs they present.

By starting the graph at January 1, 2021 whoever prepared this graph sought only to confuse. Gee, with prices rising on January 1, do you think maybe prices were already on an upward trend the day before, December 31?

In fact, the inflation rate began falling about 16 months ago and is now lower than it was during the Nixon, Reagan, or Bush-41 Administrations. This would be easier to see if the y-axis were logarithmic. Compounded rates should almost always be depicted with log scale, as any graph preparer would know provided that he or she is intelligent and interested in advancing knowledge rather than propaganda. Even better than a log y-axis would be to show the year-over-year inflation rate. In fact, until Derec posted the above graph I recall seeing compounded inflation graphed like this only in the YouTubes prepared by gold marketeers or "Libertarians." The DATA for this graph may have come from U.S. BLS but the presentation was obviously purely political propaganda.


As are the higher interest rates made necessary in order to bring the inflation down.
The 30-year fixed-rate average mortgage interest is now about as low as it EVER was throughout the 20th century, as are 10-year Treasuries. High real interest rates are a sign of a HEALTHY economy: The very low interest rates imposed after Bush-43's first recession, Bush-43's 2nd and "great" recession and the Covid pandemic are aberrations.
Meh. Facts.
Truly committed right wingers don’t let them get in the way of their Dem-demonizing fantasies.
 
Kids these days:
History is littered with examples of nations suffering from the consequences of young men finding themselves idle without purpose.
We may be in the opening stages of a social backlash to the progressive social movements of the past decades. When significant societal change occurs, some may feel left behind or cheated. Right now, young men fall into that camp.

iop.harvard.edu/youth-poll/47th-edition-spring-2024 said:
among likely young voters: President Biden's lead among young men is six points; among young women his lead is 33 points.
!!! This is a fact so disconcerting that neither webpage presented a clarifying bar-graph as they did for several other breakdowns. They did break-down "which issues are important to you" by man/woman but there was little difference between men and women there. It seems to be the maleness of males that determines their vote, not stances on issues.

Among the 18-29 age cohort, 63% of men say they are single, while only 34% of women are single. Whopping difference, considering that bigamy is illegal! I'd like to see a break-down of the Trump/Biden divide among incels vs men getting laid regularly. (Women often take older partners but this is not enough to explain the huge gap. Do we know what percent of women are lesbians?)

In my lifetime the biggest predictor of voting D vs R has undergone big changes. When labor unions were still strong, "White-collar" vs "Blue-collar" was a strong predictor; then High-Income vs Low-Income; then circa 2000 Church-going vs Not-religious was a strong predictor. A decade ago Uneducated vs College Grad was a very strong Red vs Blue predictor. But now Male vs Female is becoming the strong predictor. I do NOT see this as a good development for our political society.
 
A profound Memorial Day message from the Shitgibbon:

"Happy Memorial Day to All, including the Human Scum that is working so hard to destroy our Once Great Country, & to the Radical Left, Trump Hating Federal Judge in New York that presided over, get this, TWO separate trials, that awarded a woman, who I never met before (a quick handshake at a celebrity event, 25 years ago, doesn't count!), 91 MILLION DOLLARS for 'DEFAMATION,'" Trump wrote in the post.

"She didn't know when the so-called event took place - sometime in the 1990's - never filed a police report, didn't have to produce the 'dress' that she threatened me with (it showed negative!), & sung my praises in the first half of her CNN Interview with Alison Cooper, but changed her tune in the second half - Gee, I wonder why (UNDER APPEAL!)?

"The Rape charge was dropped by a jury! Or Arthur Engoron, the N.Y. State Wacko Judge who fined me almost 500 Million Dollars (UNDER APPEAL) for DOING NOTHING WRONG, used a Statute that has never been used before, gave me NO JURY, Mar-a-Lago at $18,000,000 - Now for Merchan!"

Every single day you can find a message from Trump and/or the GOP that communicates to the world in no uncertain terms just how fucked this country is. Today is no exception.

For the millionth time: can you imagine what the reaction would've been just 10 years ago if any politician would've said something like this?

Even the Republicans would've been like:

 
It seems the topic Biden is weakest on is the economy. The deluded masses actually think inflation has hurt them, even though it is down from its peak.
The high inflation definitely hurt people. Inflation rate may have come down, but that is just the rate of change. The cumulative effect of the last 3 years is still with us.
107385780-1710185209142-N2ySn-cumulative-inflation-in-the-u-s-since-january-2021_1.png

As are the higher interest rates made necessary in order to bring the inflation down.

The economy looks good on paper. But the reality is different for many people. Take housing. If you own your home, and perhaps a rental property too, things look good. If you are a young couple house hunting, things look dismal - the real estate prices are sky high, and the interest rates are also much higher than before. Btw, the high interest rates are also responsible for less churn in the real estate market. People who are still paying on their mortgage, but would like to sell and buy another property stay put instead because they are loathe to give up their <3% mortgage rate - which is free money right now since the inflation rate is around 3% itself.
Wow! That's a hugely bullshit graph.
 
It is true that in general real income ( income adjusted for inflation) households is greater now than Mr Biden took office. But people are reminded on a very frequent basis about inflation whenever they go buying. That is not so with income. Moreover if income rose substantially one year ago for a household, inflation will erode their purchasing power compared to a year ago and that is what people feel now.
 
A profound Memorial Day message from the Shitgibbon:

"Happy Memorial Day to All, including the Human Scum that is working so hard to destroy our Once Great Country, & to the Radical Left, Trump Hating Federal Judge in New York that presided over, get this, TWO separate trials, that awarded a woman, who I never met before (a quick handshake at a celebrity event, 25 years ago, doesn't count!), 91 MILLION DOLLARS for 'DEFAMATION,'" Trump wrote in the post.

"She didn't know when the so-called event took place - sometime in the 1990's - never filed a police report, didn't have to produce the 'dress' that she threatened me with (it showed negative!), & sung my praises in the first half of her CNN Interview with Alison Cooper, but changed her tune in the second half - Gee, I wonder why (UNDER APPEAL!)?

"The Rape charge was dropped by a jury! Or Arthur Engoron, the N.Y. State Wacko Judge who fined me almost 500 Million Dollars (UNDER APPEAL) for DOING NOTHING WRONG, used a Statute that has never been used before, gave me NO JURY, Mar-a-Lago at $18,000,000 - Now for Merchan!"

Every single day you can find a message from Trump and/or the GOP that communicates to the world in no uncertain terms just how fucked this country is. Today is no exception.

For the millionth time: can you imagine what the reaction would've been just 10 years ago if any politician would've said something like this?
Not one mention of the reason for this holiday. Wutta POS.
 
  • Like
Reactions: SLD
To condemn Netanyahu's atrocities is to be lumped with Islamist terrorists -- do I have that right? IDS (Ilkish Derangement Syndrome) is strong among some of us here.
Did you even read the article? Rashida Tlaib did not just condemn Netanyahu (while failing to condemn Hamas) but she participated in a conference that was organized by PFLP (US designated terrorist organization) where 10/7 massacre that started this was was defended.
e2ba6c44-cfcc-4dab-903b-cfa7c1afef60_text.gif


We can often tell whether someone is a seeker of knowledge, or just a propagandist by looking at the graphs they present.
This graph is by CNBC, a reputable news organization.

By starting the graph at January 1, 2021 whoever prepared this graph sought only to confuse. Gee, with prices rising on January 1, do you think maybe prices were already on an upward trend the day before, December 31?
No doubt. The point, however is, that part of the reason why people feel bad about the economy is the cumulative inflation over the last few years.
In fact, the inflation rate began falling about 16 months ago and is now lower than it was during the Nixon, Reagan, or Bush-41 Administrations.
So? I did not claim the inflation rate has been lowered (mostly through monetary policy by Fed) even if it is still above the Fed target of 2%. But the fact still remains that people feel blase about the economy in part because of the effects of cumulative inflation over the last few years.
This would be easier to see if the y-axis were logarithmic. Compounded rates should almost always be depicted with log scale, as any graph preparer would know provided that he or she is intelligent and interested in advancing knowledge rather than propaganda.
Knowledge of what exactly? And if you have a graph you think is better, please post it so we can discuss it. I think for the purposes of the point I was trying to make, the graph was sufficient.
Even better than a log y-axis would be to show the year-over-year inflation rate.
No, because my point is that even though inflation rate has been brought down, the cumulative effects of inflation in 2021, 2022 and 2023 are still with us in form of higher prices.
In fact, until Derec posted the above graph I recall seeing compounded inflation graphed like this only in the YouTubes prepared by gold marketeers or "Libertarians." The DATA for this graph may have come from U.S. BLS but the presentation was obviously purely political propaganda.
It's not propaganda. It explains why people feel bad about high prices even if the inflation rate has decreased from the 9% peak.
The 30-year fixed-rate average mortgage interest is now about as low as it EVER was throughout the 20th century, as are 10-year Treasuries.
True. But they are higher than they were in the 21st century, and that is what people got used to. In particular, many people are still paying off <3% mortgages and are loathe to give them up - if they sell now and buy another property they have to take a 6-7% mortgage.
You have the combination of increased real estate prices and higher interest rates making home ownership unattainable for many that could have attained it if they were in the market only 5 years ago.

High real interest rates are a sign of a HEALTHY economy: The very low interest rates imposed after Bush-43's first recession, Bush-43's 2nd and "great" recession and the Covid pandemic are aberrations.
While it is true that very low interest rates are usually imposed to stimulate the economy in recessions, higher interest rates now are a product of Fed fighting high inflation. And that inflation was, in part, caused by Biden administration's loose fiscal policy. COVID giveaways lie expanded unemployment, expanded child tax credit and the last cash stimulus, were continued well after the economy reopened in 2021. Combine that with supply chain shortages and you had both supply side and demand side pressure on inflation. Note also that Biden administration wanted to exacerbate the problem with additional $3,500,000,000,000.00 in non-infrastructure spending. Thank FSM for Sinema and Manchin! They will be sorely missed in the Senate.

Now, I am not saying all that the Biden administration has done was wrong. It accomplished some good things, like the bipartisan infrastructure bill. And the economy is still good overall - low unemployment, good stock market etc. But at the same time, we have to recognize why many people feel that the economy is bad despite these metrics. And people who point that out should not be dismissed as "MAGA" or "Ilkists".
 
Wow! That's a hugely bullshit graph.
Why?
Considering Swammerdami beat me to it and you didn't respond to his explanation, I'll post it here again for you.

By starting the graph at January 1, 2021 whoever prepared this graph sought only to confuse. Gee, with prices rising on January 1, do you think maybe prices were already on an upward trend the day before, December 31?

In fact, the inflation rate began falling about 16 months ago and is now lower than it was during the Nixon, Reagan, or Bush-41 Administrations. This would be easier to see if the y-axis were logarithmic. Compounded rates should almost always be depicted with log scale, as any graph preparer would know provided that he or she is intelligent and interested in advancing knowledge rather than propaganda. Even better than a log y-axis would be to show the year-over-year inflation rate. In fact, until Derec posted the above graph I recall seeing compounded inflation graphed like this only in the YouTubes prepared by gold marketeers or "Libertarians." The DATA for this graph may have come from U.S. BLS but the presentation was obviously purely political propaganda.

And do you have a better one?
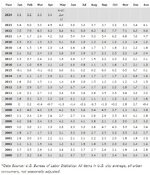
Inflation by month.jpg
 
A better one eould have a measure of real income as well.
Then I suggest you either find, or make, one.
I was looking for a cumulative inflation graph and found this one. People are sensitive to price increases even if they get raises. That explains why people feel bad about the economy despite good metrics.
 
Considering Swammerdami beat me to it and you didn't respond to his explanation, I'll post it here again for you.
I just did.
[a table]
That's a table, not a graph, and it is not cumulative.
My point is that even though inflation has come down a lot, the cumulative inflation means that prices are still high and that is one reason why people feel bad about the economy. Hence, a cumulative graph is necessary.
 
Among the 18-29 age cohort, 63% of men say they are single, while only 34% of women are single. Whopping difference, considering that bigamy is illegal!
It is only illegal to marry two (or more) people. It is not illegal to be a player and date several women at the same time. Part of the discrepancy is due to that no doubt. Another likely reason is that there are many 20-something sugar babies dating older sugar daddies (or glucose guardians if you want to be alliterative). Fewer young men date sugar mommies.

But now Male vs Female is becoming the strong predictor. I do NOT see this as a good development for our political society.
Neither do I. Of course, Dems are not doing much to attract the male vote.
 
A better one eould have a measure of real income as well.
Then I suggest you either find, or make, one.
I suggest if you want to make a convincing argument, don’t make a half- assed graph and then whine when you are called on it.

Derec said:
I was looking for a cumulative inflation graph and found this one. People are sensitive to price increases even if they get raises. That explains why people feel bad about the economy despite good metrics.
By itself, it does not because prices are almost always higher over time.
 
I suggest if you want to make a convincing argument, don’t make a half- assed graph and then whine when you are called on it.
The graph was sufficient for the point I was making. And I did not make it, CNBC did.
Besides, if you want to see "half-assed", Zipr's table that is not even cumulative surely qualifies.
By itself, it does not because prices are almost always higher over time.
Usually not this quickly. In 2022, inflation peaked at 9%. That is still with us even if the inflation rate (i.e. rate of further increase) has come down (but still not as low as the Fed target).
 
I suggest if you want to make a convincing argument, don’t make a half- assed graph and then whine when you are called on it.
The graph was sufficient for the point I was making.
It wasn’t.
Derec said:
Usually not this quickly. In 2022, inflation peaked at 9%. That is still with us even if the inflation rate (i.e. rate of further increase) has come down (but still not as low as the Fed target).
The past effect of inflation is with us regardless of its past size or speed.
 
To condemn Netanyahu's atrocities is to be lumped with Islamist terrorists -- do I have that right? IDS (Ilkish Derangement Syndrome) is strong among some of us here.
We can often tell whether someone is a seeker of knowledge, or just a propagandist by looking at the graphs they present.
This graph is by CNBC, a reputable news organization.
No, it was by an employee. Not everyone that works at CNBC is left wing.

By starting the graph at January 1, 2021 whoever prepared this graph sought only to confuse. Gee, with prices rising on January 1, do you think maybe prices were already on an upward trend the day before, December 31?
No doubt. The point, however is, that part of the reason why people feel bad about the economy is the cumulative inflation over the last few years.
In fact, the inflation rate began falling about 16 months ago and is now lower than it was during the Nixon, Reagan, or Bush-41 Administrations.
So? I did not claim the inflation rate has been lowered (mostly through monetary policy by Fed) even if it is still above the Fed target of 2%. But the fact still remains that people feel blase about the economy in part because of the effects of cumulative inflation over the last few years.
This would be easier to see if the y-axis were logarithmic. Compounded rates should almost always be depicted with log scale, as any graph preparer would know provided that he or she is intelligent and interested in advancing knowledge rather than propaganda.
Knowledge of what exactly? And if you have a graph you think is better, please post it so we can discuss it. I think for the purposes of the point I was trying to make, the graph was sufficient.
Even better than a log y-axis would be to show the year-over-year inflation rate.
No, because my point is that even though inflation rate has been brought down, the cumulative effects of inflation in 2021, 2022 and 2023 are still with us in form of higher prices.
In fact, until Derec posted the above graph I recall seeing compounded inflation graphed like this only in the YouTubes prepared by gold marketeers or "Libertarians." The DATA for this graph may have come from U.S. BLS but the presentation was obviously purely political propaganda.
It's not propaganda. It explains why people feel bad about high prices even if the inflation rate has decreased from the 9% peak.
The 30-year fixed-rate average mortgage interest is now about as low as it EVER was throughout the 20th century, as are 10-year Treasuries.
True. But they are higher than they were in the 21st century, and that is what people got used to. In particular, many people are still paying off <3% mortgages and are loathe to give them up - if they sell now and buy another property they have to take a 6-7% mortgage.
You have the combination of increased real estate prices and higher interest rates making home ownership unattainable for many that could have attained it if they were in the market only 5 years ago.

High real interest rates are a sign of a HEALTHY economy: The very low interest rates imposed after Bush-43's first recession, Bush-43's 2nd and "great" recession and the Covid pandemic are aberrations.
While it is true that very low interest rates are usually imposed to stimulate the economy in recessions, higher interest rates now are a product of Fed fighting high inflation. And that inflation was, in part, caused by Biden administration's loose fiscal policy. COVID giveaways lie expanded unemployment, expanded child tax credit and the last cash stimulus, were continued well after the economy reopened in 2021. Combine that with supply chain shortages and you had both supply side and demand side pressure on inflation. Note also that Biden administration wanted to exacerbate the problem with additional $3,500,000,000,000.00 in non-infrastructure spending. Thank FSM for Sinema and Manchin! They will be sorely missed in the Senate.

Now, I am not saying all that the Biden administration has done was wrong. It accomplished some good things, like the bipartisan infrastructure bill. And the economy is still good overall - low unemployment, good stock market etc. But at the same time, we have to recognize why many people feel that the economy is bad despite these metrics. And people who point that out should not be dismissed as "MAGA" or "Ilkists".
A cumulative graph that starts when Biden took office. Unless they did the same with Trump or other presidents or heads of state, it's highly partisan bullshit.
 
A better one eould have a measure of real income as well.
Then I suggest you either find, or make, one.
I was looking for a cumulative inflation graph and found this one. People are sensitive to price increases even if they get raises. That explains why people feel bad about the economy despite good metrics.
Telling half truths is why so many people that are doing better but still see the economy as bad.
 
Polymarket now shows Trump 56%, Biden 37% to win in November. Betfair shows 53% vs 35%.

This certainly does seem ridiculous. Trump is charged with 90+ felonies, is a traitor allied with Russia and the other worst geopolitical players; plans on fascist rule; and is a malignant narcissist. I am tempted to bet against this incontinent semi-literate cretin -- the loss of a fortune would seem inconsequential compared with the gloom and grief if this horrid creature wins.

And yet, Trump really is likely to win! Consult Thom Hartmann's free newsletter. Does this link work?
 
Back
Top Bottom