Solar-cell efficiency refers to the portion of energy in the form of sunlight that can be converted via photovoltaics into electricity by the solar cell.
The efficiency of the solar cells used in a photovoltaic system, in combination with latitude and climate, determines the annual energy output of the system. For example, a solar panel with 20% efficiency and an area of 1 m2 will produce 200 kWh/yr at Standard Test Conditions if exposed to the Standard Test Condition solar irradiance value of 1000 W/m2 for 2.74 hours a day. Usually solar panels are exposed to sunlight for longer than this in a given day, but the solar irradiance is less than 1000 W/m2 for most of the day. A solar panel can produce more when the sun is high in the sky and will produce less in cloudy conditions or when the sun is low in the sky, usually the sun is lower in the sky in the winter.
When it comes to regions, two important aspects that affect the solar PV industry's efficiency are the dispersion and intensity of solar radiation. These two variables vary greatly between each country.[1] The main global regions that get subjected to high radiations throughout the year are regions in Asia like the middle east, Northern Chile, Australia, China, and Southwestern USA.[1][2] In a high-yield solar area like central Colorado, which receives annual insolation of 2000 kWh/m2/year,[3] such a panel can be expected to produce 400 kWh of energy per year. However, in Michigan, which receives only 1400 kWh/m2/year,[3] annual energy yield will drop to 280 kWh for the same panel. At more northerly European latitudes, yields are significantly lower: 175 kWh annual energy yield in southern England under the same conditions.[4]
Schematic of charge collection by solar cells. Light transmits through transparent conducting electrode creating electron hole pairs, which are collected by both the electrodes. The absorption and collection efficiencies of a solar cell depend on the design of transparent conductors and active layer thickness.[5]
Several factors affect a cell's conversion efficiency value, including its reflectance, thermodynamic efficiency, charge carrier separation efficiency, charge carrier collection efficiency and conduction efficiency values.[6][5] Because these parameters can be difficult to measure directly, other parameters are measured instead, including quantum efficiency, open-circuit voltage (VOC) ratio, and § Fill factor. Reflectance losses are accounted for by the quantum efficiency value, as they affect "external quantum efficiency". Recombination losses are accounted for by the quantum efficiency, VOC ratio, and fill factor values. Resistive losses are predominantly accounted for by the fill factor value, but also contribute to the quantum efficiency and VOC ratio values. In 2019, the world record for solar cell efficiency at 47.1% was achieved by using multi-junction concentrator solar cells, developed at National Renewable Energy Laboratory, Golden, Colorado, USA.[7]
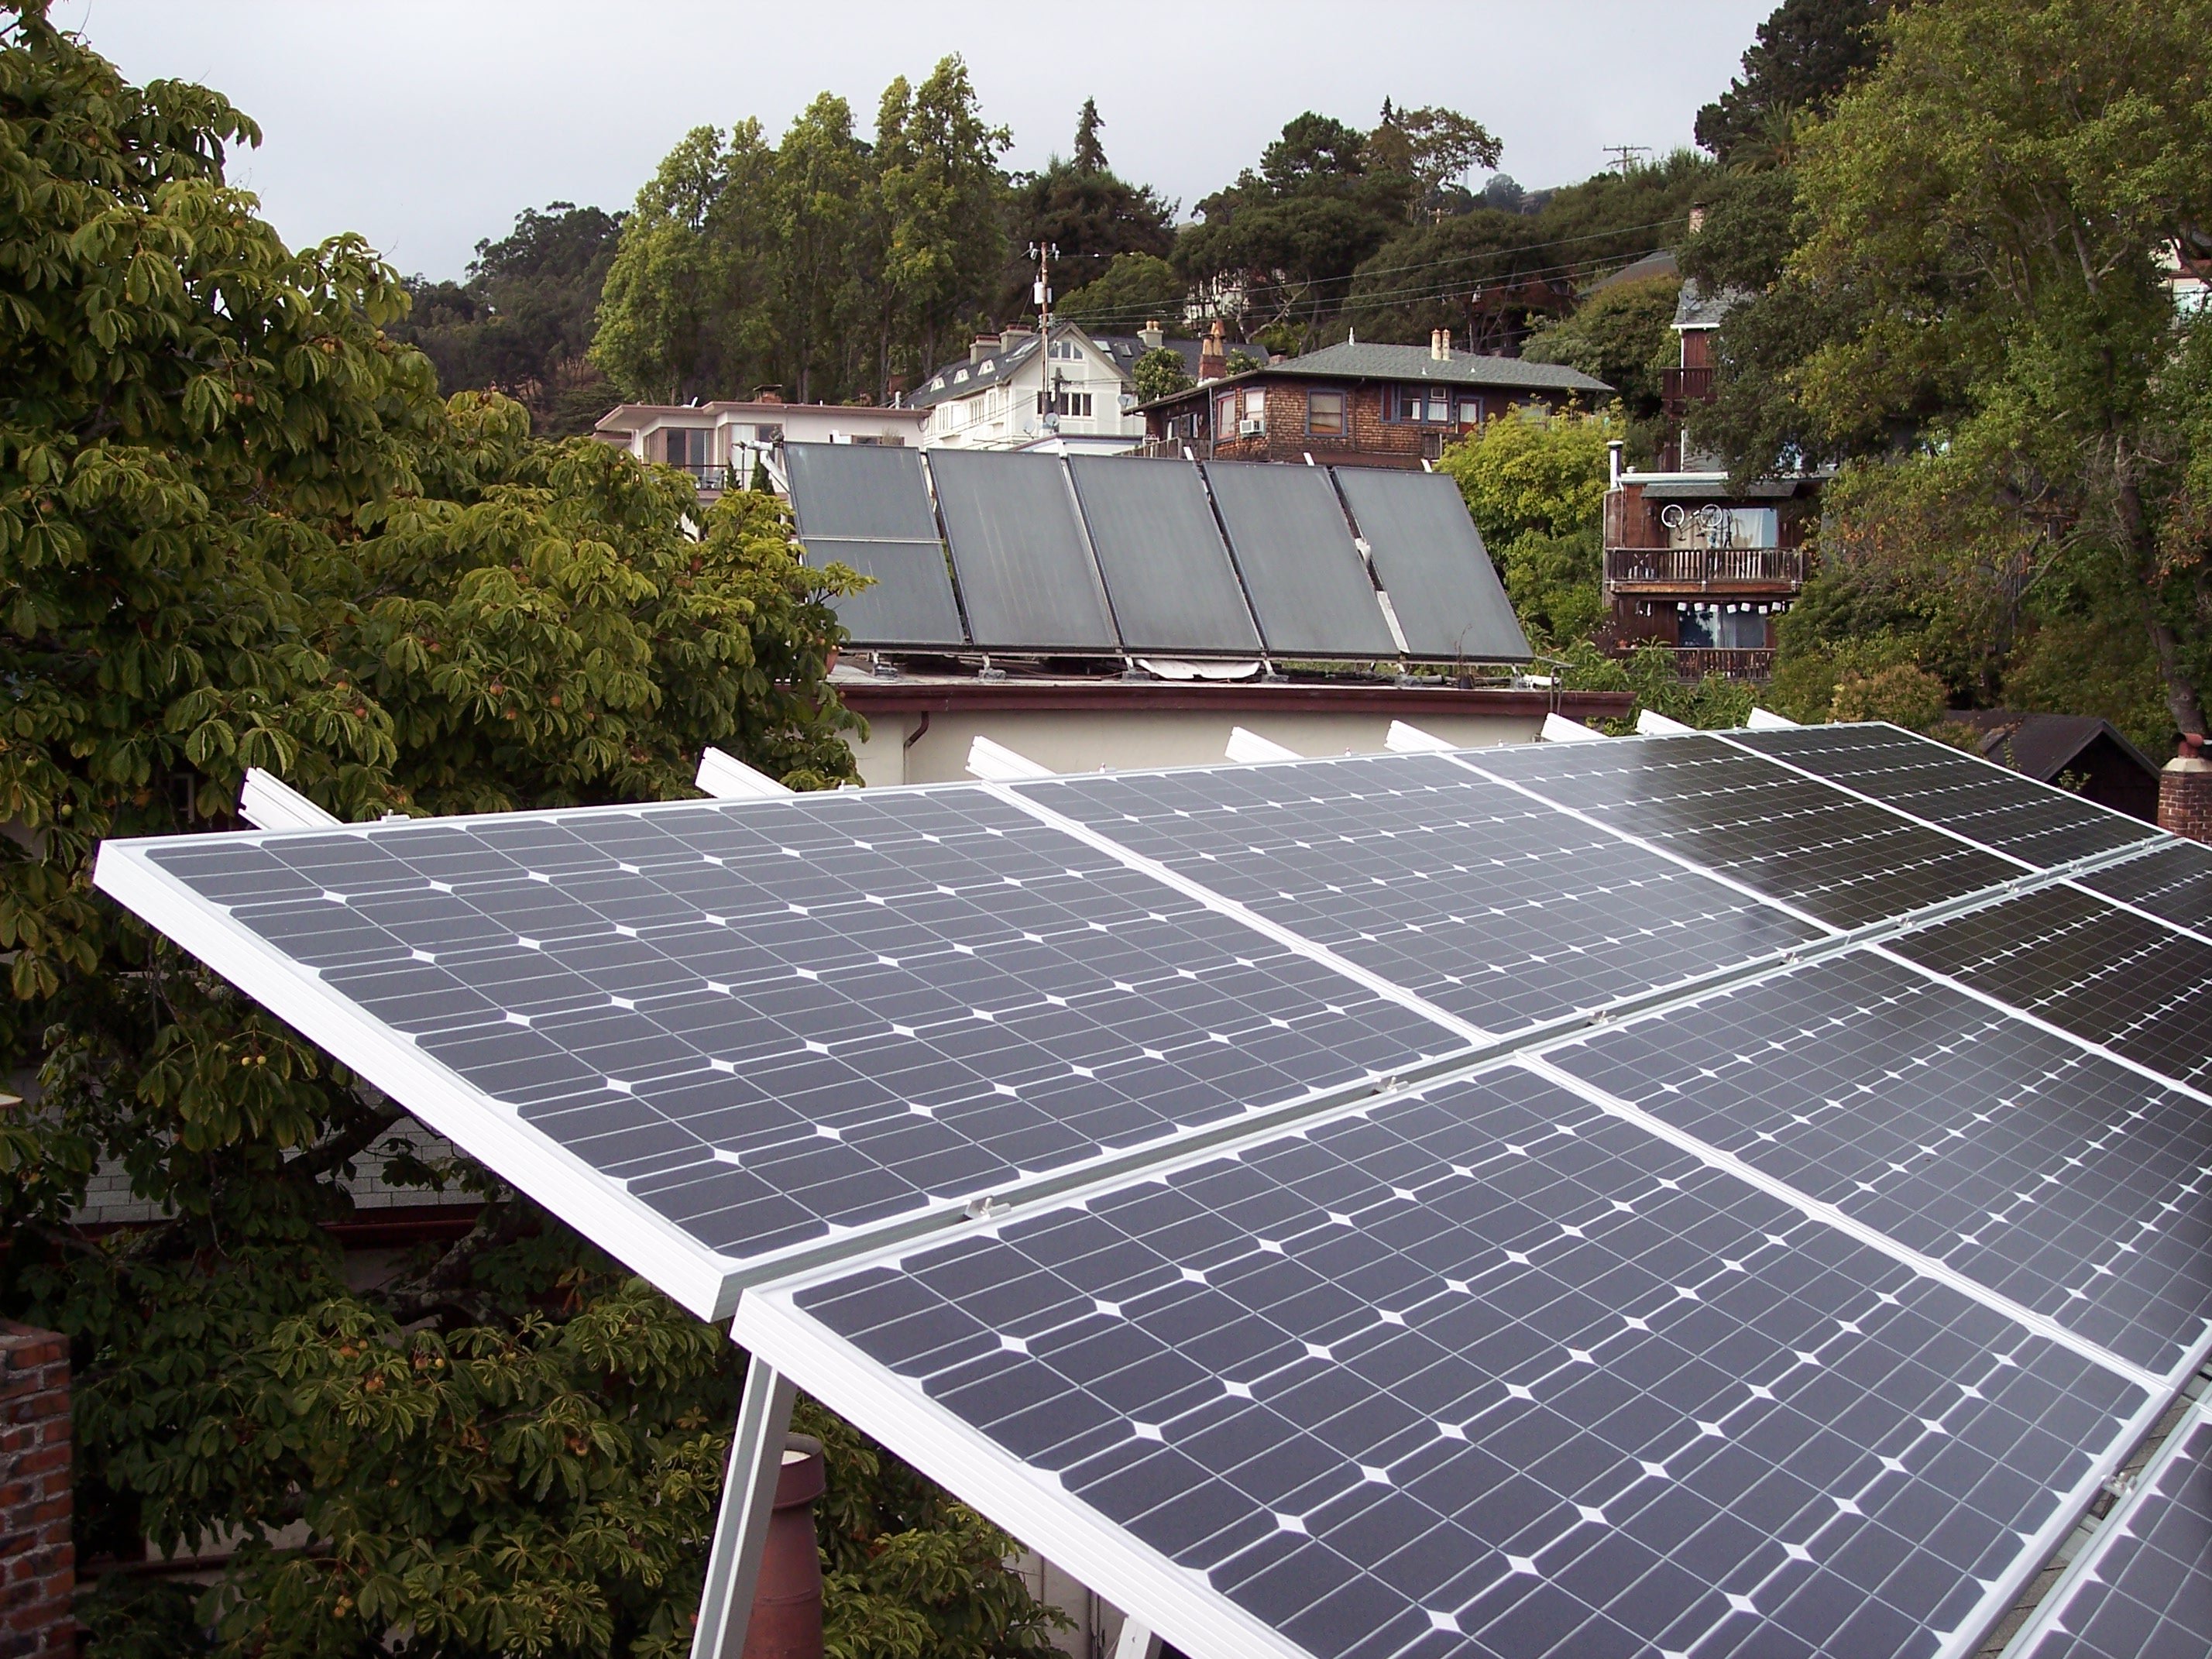
Solar panels 𝗰𝗼𝗻𝘃𝗲𝗿𝘁 𝟭𝟱% 𝘁𝗼 𝟮𝟮% of the sun's energy into electricity. Let's take a closer look at the efficiency of this renewable technology, to help you understand whether they're right for your home!

www.greenmatch.co.uk
Solar panels are usually able to process 15% to 22% of solar energy into usable energy, depending on factors like placement, orientation, weather conditions, and similar. The amount of sunlight that solar panel systems are able to convert into actual electricity is called performance, and the outcome determines the solar panel efficiency.