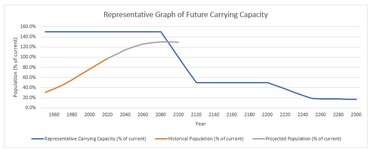
What population will the future world hold? In 1900, before oil and gas were widely used, the world population was 1.6 billion. One could make the case that we could not reasonably sustain human existence far above that level without the benefits of oil and gas. Are we limited to 2 billion people in the long term instead of the current 8 billion? Christopher Tucker suggests we should limit population to 3 billion (
Götmark, 2020;
Tucker, 2019). Aisha and Partha Dasgupta say the population should be between 0.5 and 5 billion (
Cafaro, 2021;
Dasgupta, 2017). An argument based on Ecological Footprint by Martin Desvaux says we need to get down below 3 billion people. (
Desvaux, 2007). A number of people have estimates under 4 billion (
Samways, 2022;
Crist, 2022). Others, such as the Earth4All People and Planet Report (
Callegari, 2023) say we could reach 14 billion with redistribution of wealth and huge technology improvements. Estimates vary widely (
Dérer, 2018 ;
Pengra, 2012).
All of this depends on our lifestyle and technology we come to use. With reduced affluence and better use of technology, we could have more people on this planet. Paul Ehrlich famously proposed a formula for our impact on the planet: I=PAT. This equation says that our impact is equal to the population times the level of affluence times a factor based on the technology in use (
Desvaux, 2007;
Ward, 2016). This gives us three levers that we could use to limit our impact: population, affluence, and technology. We will look at each of these in the sections below. If the total impact caused by this combination of population, affluence and technology-in-use is such that serious overshoot continues, then we risk a ghastly future (
Bradshaw, 2021).
For now, I will show a simple curve that summarizes where the capacity limits of global population might be if technology improvements or affluence reduction levers did not save us. The curve is illustrative of Earth’s instantaneous carrying capacity as it could vary in time. We don’t know where the actual limits are.
The curve begins at some level above our current population, beyond which we cannot exceed without risk of imminent collapse. As time goes on the planet will degrade further due to overshoot, and that will lower the instantaneous carrying capacity. This also could trigger a collapse. I show this as a downturn in the blue carrying capacity line. This could possibly happen by the end of this century based on estimates listed earlier. Of course, better use of technology or lowering the average affluence could move this curve higher or shift it right. We will explore those options later.
The second downturn in the graph below represents a further decrease due to depletion of fossil fuels and mineral deposits. At that point we may find the instantaneous carrying capacity of the Earth drops still further. I show this possibly occurring by 2250, when even Mohr’s best-case estimate for future fossil fuels shows most fossil fuels will have been used up (
Mohr, 2015). As we will see later, the available alternative energy sources might not rescue us from an energy crash at that point. Of course, we might find that substitutes really do work out for us and move that blue line upward and to the right. But for now, consider there is some limit to the carrying capacity of the Earth in the future, and that this will be decreasing with time as the planet is trashed and resources are consumed.
Wherever the blue curve lies, if our population curve exceeds the limit, we risk nature itself forcing our population to drop below the line.

