lpetrich
Contributor
How Suburbs Decided the 2020 Election for Biden
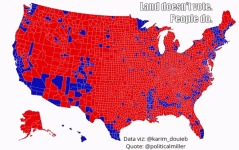
Back to the CPR.Most of the red counties have densities of fewer than 500 people per square mile. Most of the purple counties are clustered at densities of between 400 and 1,500 people per square mile. And the blue counties are those above 1,500 people per square mile. While there are notable exceptions to this pattern, the basic trend suggests the dominant role suburban density plays in American political life.
This partisanship by density explains the "sea of red" maps, of Democratic islands surrounded by a sea of Republicans.This Democratic headway into fast-growing exurbs represents a serious threat to the GOP grip on these sunbelt states. As Dante Chinni, a political analyst for the Wall Street Journal and NBC and expert on the geographic distribution of the vote, argued in his recent analysis of the 2020 election: "Republican candidates need big margins out of those exurb counties to help offset the Democrats big wins in the urban suburbs and big cities." And, as we've seen in states like Virginia, once these exurbs start to turn blue, they don't turn back. Northern Virginia's Loudoun County flipped red to blue in 2008, with Obama carrying this county by 8 points. In 2020, Biden carried the once rural county by 25 points.


