Bomb#20 said:
You're missing the point. It's not that the institutional mission and/or specific public-need criteria are discriminatory; it's that the schools are not measuring candidates on mission fitness and fulfilling public-need criteria. The schools are not lowering the MCAT standard a student needs to meet because he's going to work in an underserved area. They don't know if he is; this isn't Minority Report and they aren't precogs. They're using a proxy. Ability to do well in school is an important quality in medical students, so what say we check "how the demographic groups actually rank" in that characteristic, observe that it's f(school success) = { 3 if NA; 5 if Black or Hispanic; 7 if White; 9 if Asian }, and then use that to judge applicants instead of, you know, actually looking at their GPAs? You'd agree assuming an Asian has a high GPA and a NA has a lower one, as a proxy, instead of actually measuring, would be racial discrimination, yes?
The claim that evaluating mission fitness requires "precognition" or serves as a blind substitute for GPA creates a false dichotomy. Admissions committees do not throw out transcripts to use race as a proxy; they evaluate a multivariate set of inputs where GPA, MCAT, essays, interviews, (and state residency
or this can be a factor) are weighed concurrently. Claiming that non-numerical evaluation is invalid because committees aren't "precogs" would logically invalidate every job interview, letter of recommendation, or holistic assessment in higher education. Furthermore, we know non-MCAT structural factors heavily influence these weights: states like West Virginia, Mississippi, and North Dakota have resident acceptance rates between 48% and 58% despite lower average MCAT scores. These schools explicitly weigh state residency and public-need missions heavily to address regional physician shortages, proving that non-MCAT criteria routinely drive acceptance rates independently of racial proxies. They do so without throwing out MCATs or GPAs.
I didn't say they do -- I was making an analogy to a hypothetical practice. My point was that you're talking about using a proxy instead of actually measuring what they want to select for, and using a racial proxy is still racial discrimination even if the thing you're trying to select for isn't.
Bomb#20 said:
No doubt you'll argue that "essays and interviews assessing a candidate's commitment to working in underserved areas" isn't a racial proxy, but what evidence is there that that's true? What do those essays and interviews actually measure? Do they measure actual mission fitness, or do they just measure race? That's something that's testable retrospectively. If in fact schools aren't racially discriminating and the MCAT discrepancy results from relying on essays and interviews to forecast mission fitness, and if that allegedly nonracial proxy accurately predicts working in underserved areas, then that implies we could take a random sample of minority doctors who work in underserved areas, and a random control group of minority doctors who don't work in underserved areas, and check what their MCAT scores were back when they were accepted into medical school -- and the control group who don't work in underserved areas should turn out to have had MCAT scores similar to those of Asian and white matriculants. Only the group working in underserved areas would have statistically gotten the benefit of the relaxed MCAT requirements.
Your proposed retrospective experiment contains a fundamental flaw regarding base-rate distributions and multivariate confounding. You cannot isolate the MCAT in a vacuum after the fact, because every doctor in that admitted cohort was accepted based on a combined threshold of GPA, MCAT, interview scores, school, geography, etc. Because the starting applicant pool for any demographic has its own baseline distribution, splitting that admitted group retroactively based on practice location will yield similar average MCATs across both subgroups.
If that's true then the proxy they use to assess mission-fitness must correlate poorly with doctors ultimately actually working in underserved areas. If we can see a systematic difference in matriculants' MCAT/GPA by race, but we can't see a systematic difference by practice location, that would seem to imply the proxy predicts race better than practice location.
I apologize for the confusion I caused by mentioning a "proxy" in my earlier posts. I was merely spitballing theoretical adcom behaviors, but I completely agree with you: using a racial proxy to predict commitment to underserved areas would be unfair and discriminatory. However, that isn't how "mission fitness" is actually implemented. I am not saying there is never discrimination. I am saying that is not what I had meant by mission fitness. Schools typically use essays, secondary applications, clinical work and interviews to directly examine a candidate's career goals and commitment to specific communities. We can see that the result of doing this holistic assessment yields a result of different MCAT means across demographics. So, it seems like it would be absurd to also have a massive national conspiracy to throw out those direct, individualized assessments in favor of a racial proxy that would be producing the same result anyway.
Regarding practice location vs racial proxy: There is a study I linked. It went through all practice locations, all race assignments from AAMC for graduates from the year ranges, and a geographic map of all 3 types of underserved areas across the US. This is how significant differences in frequencies for demographics were computed.
And regarding the formula or correlation I observed earlier with a mission fitness variable, I actually do not believe there is some universal formula applicable to each school, but rather it is something you may observe in the aggregate. Not every school has the same mission and while many mention diversity, there are specific schools with mission statements including tribal areas, rural areas, etc.
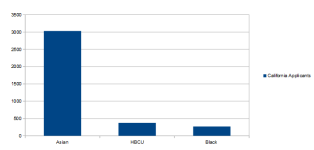
Additionally, this experiment ignores massive geographical confounders. Demographic groups do not reside evenly across the country; for example, a high concentration of Asian premed applicants reside in California, where intense in-state competition drops the overall acceptance rate to ~40.6% despite high average stats. Conversely, state schools in rural regions accept residents at much higher rates to fill local needs. Because state-level capacity and regional bottlenecking create acceptance rates that sit both well above and well below national racial averages, treating national MCAT variances as a pure function of racial preferences misses a broader structural picture that is heavily driven by public need.
That's a fair point; to properly account for it we'd need data broken down school by school. The schools typically don't release it, which is exactly what we'd expect if the state variances were the function of racial preferences that the national variances look like.
The reason schools don't publicly release all their granular data to prove this is because they are tightly bound by FERPA and liability concerns. This enforced silence unfortunately creates a vacuum where one-sided political narratives and conspiracy theories easily take root. That doesn't mean that some schools aren't hiding things, but that there is a general reason for it.
There are other things to consider besides a hypothesis of racial preferences: National racial acceptance rates are heavily distorted by regional bottlenecks and state-specific policies. For example, states with no medical schools (like Maine, Alaska, Wyoming, and some others) actually buy seats ahead of time at out-of-state schools based purely on projected need, resulting in massive variance in acceptance rates in those states.
If you compare California and Texas, the structural noise becomes obvious. In California, the in-state acceptance rate is a brutal 16.4% (7,216 applicants for 1,184 public in-state matriculants). Texas, conversely, mandates by state law that 90% of its public medical school seats go to residents and they have many more state medical school seats available, resulting in an in-state acceptance rate of 31.4%.
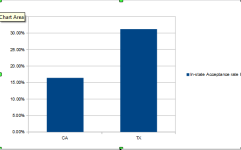
Because CA has relatively few public seats for its massive population, its residents are forced to apply to highly competitive private schools. As a result, the MCAT mean of all matriculants in CA is pushed up to 513.9, compared to TX at 512.7. Since a massive concentration of the nation's Asian applicants reside in CA, this regional bottleneck artificially depresses the national Asian acceptance rate (
41.74% in CA vs. 45.17% in the rest of the US) and drives up their required MCAT mean. Throw in localized factors--like a small HBCU in California that attracts a distinct, self-selected applicant pool--and it becomes clear how easily state-level structural quirks can be both misread and impactful.
To test this mathematically, I ran a simulation of a medical school similar to the Medical College of Georgia (MCG). Interestingly, this school accepts very few non-residents (~98% are in-state), which underscores the point again about geographic enrollment constraints. Using recent data, we have about 1,821 in-state US citizen and permanent resident applicants competing for roughly 304 enrollment spots.
Even assuming every medical school applicant in Georgia applies to this school, we can use the national MCAT and GPA means and standard deviations for each racial cohort to accurately represent the baseline applicant pool.
Then, I ran a holistic admissions committee scoring algorithm on that simulated pool. I made it 100% race-blind, and to your favor, I completely excluded any "mission fitness" variables or simulated questions about SES/economic adversity. The algorithm simply uses MCAT and GPA (accounting for the fact that the two are correlated, so they aren't completely independent) and adds three other completely race-blind metrics--it doesn't matter if they represent transcripts, recommendations, clinical work, community service, secondary essays, or interviews. That is 5 metrics weighted equally. ZERO "mission fitness," meaning no evaluations about where someone's career might take them (which would naturally give a fair aggregate advantage to Black and Hispanic applicants over White and Asian applicants). Just a pure, strictly race-blind holistic score.
The result? Black applicants still get accepted. Hispanic applicants still get accepted. And a significant gap between their MCAT means still naturally emerges. For example, Asian matriculants can still have a 7.0+ higher MCAT mean over Black matriculants even under a strictly race-blind admissions algorithm.
... It is ultimately why Bomb#20 doesn't even need my source code--he could write this simulation himself in five minutes. Let's look at the math here. We have a number of parameters (p
1, p
2, ... p
n) normalized to decimals between 0 and 1, weighted evenly into an average:
Score = 1/n*(p1 + p2 + p3 + ... + pn)
If p
1 is the MCAT, adding more parameters ( n ) mathematically dilutes the correlation between p
1 and the final score. As n approaches infinity, the correlation between the MCAT and the final score approaches zero. ...
I did write a simulation myself in five minutes, and then I tuned its parameters until it approximated the applicant and matriculant statistics in the table linked upthread, at which point it clearly showed Asian students needed higher MCATs than NA students to have the same chance of admission*. It sounds like your simulation by construction makes that impossible, so I asked for your code to see if your model also reproduces the statistics in the table. If you don't want to post it I can work from your description, no worries. Three questions then: How did you account for MCAT and GPA being correlated? What were the standard deviations of your other simulated parameters? And did you also use normal distributions for your other simulated parameters? (The AAMC constructs the MCAT to be normally distributed.)
Here's the thing. What you said makes sense -- as n goes to infinity, the difference in mean MCAT scores between Asian and Black matriculants will naturally approach the difference in mean MCAT scores between Asian and Black applicants, so if you saw 7.0+ that's just what's to be expected given the data in the table. But another thing also happens as n goes to infinity: the difference in mean MCAT scores between Asian matriculants and Asian applicants will naturally approach zero; and likewise the difference in mean MCAT scores between Black matriculants and Black applicants. Based on the table, that doesn't happen in real life. So in the asymptotic limit your model can't be correct. But of course we aren't at the asymptotic limit. So we need to check what happens when n=5, using your model's actual distributions for your other simulated parameters.
(* My upthread example of an Asian and NA student with 509 MCAT scores turned out to only show a slight difference in admission probability -- the difference is much more pronounced at lower scores.)
So far as American Indians, a good portion apply to a handful of schools because the schools have low MCAT minima and missions related to tribal or underserved areas. We are only discussing 33 AI/AN matriculants. If there are 3 matriculated NA medical students at the Duluth campus in Minnesota, that is 10% of the whole cohort.
Also, it sounds like our simulations had different goals. I wasn't attempting to perfectly reproduce the entire national AAMC table, because, as I noted above with the CA/TX comparison, national statistics are a muddy amalgamation of 50 different states' geographic constraints and unique school missions, not to mention different school requirements, sometimes minima and sometimes residency requirements.
My goal was simply to look at a highly insular school (like the Medical College of Georgia, which is ~98% in-state) and prove a mathematical concept: that a strictly race-blind, holistic algorithm can still naturally produce a significant MCAT gap between demographic cohorts. Without applying any further tuning, the simulation consistently output plausible* enrollment rates for that specific school while maintaining a pronounced MCAT gap. *I only ran it a few times and 2 of 3 it had slightly lower enrollment rates but not by much and 1 time it was approximately the same as published for the groups I was looking at.
I will try to answer these:
How did you account for MCAT and GPA being correlated?
I sent you a PM.
What were the standard deviations of your other simulated parameters? And did you also use normal distributions for your other simulated parameters? (The AAMC constructs the MCAT to be normally distributed.)
I simply generated them as uniform pseudorandom variables between 0 and 1. As we both noted, as you increase the number of these holistic variables, the predictive weight of the MCAT naturally dilutes.