• Welcome to the new Internet Infidels Discussion Board, formerly Talk Freethought.

NASA engineers

Emily Lake:
Allow me to clarify; you can calculate variance, but the credibility of that variance is very low. The variance calculated is meaningless from a statistical perspective. With only 5 samples, there is no indication of the actual distribution. Consider a normal distribution - it has long tails, and there is always a chance, however small, of getting a sample that is far out on one of the tails. So let's say you take a sample of {1,5,9,21,110} You can calculate a mean of 29.2 and a standard deviation of 45.8, sure. You can do the calculation. But that sample isn't necessarily representative. It could easily turn out that the true mean is actually around 10, and the true standard deviation is around 5. And if you took a sample of 500, you would see that distribution emerge. But because you took only 5 samples, and one of them was far out on the right hand tail, it is skewing your apparent results.
You are missing the point. Any estimate is open to error (otherwise it would not be an estimate), that does not absolve one of the responsibility of reporting it. Note that we are not just reporting the sample SD as an estimate of the population SD, we are reporting it to characterize the sample. More importantly, the mean is just as open to error as is the variance. Just look at the example you gave: exactly how meaningful is the mean of 29.2? None of the observed values was anywhere near the mean. If we were told just the mean, we would have no way of knowing how likely it is that a second sample of the same size would be similar. However, if we are told the mean of 29.2 and the SD of 45.8 then we would know that a second estimate could easily be quite different. Your own example shows just how important it is to report an estimate of variance.

Compare that to a different data set with the same mean: {25, 27, 28, 30, 36}. Here the SD is 4.2. This tells the informed reader something important about that sample.

NASA can report that they got results of {a,b,c,d,and e}. It would be statistically irresponsible of them to calculate standard deviations and errors from a sample size that small.
No more than it "would be statistically irresponsible of them to calculate" means "from a sample size that small". In fact I consider it "statistically irresponsible" to report the mean without any estimate of variability.

Peez
 
Emily Lake:
Not with any credibility. Have you never taken a statistics course? In my opinion it's worse to imply credibility where there is none, than to omit a calculation that would be non-credible. You're insisting that they include a number that is both meaningless and misleading simply for the sake of form?
A sample size of 5 is not large, for a mean or a variance, and a sample size of 2 is not normally something that should be analyzed at all. However, if a mean can be meaningfully calculated then an estimate of variability should be reported with it. In case it makes any different, I have taught statistics.

Peez
 
Loren Pechtel:
And that 110 is more likely a measurement goof than random error anyway.
That is certainly something that should be considered, though some values can have strange distributions (and small samples can sometimes come out with strange distributions even when the underlying variable does not).
I think the question should be whether he has understood a statistics course. I've seen all too many people who took a statistics course but did it by rote with no real understanding of how it applied to the real world.
Too true.

Peez
 
Emily Lake:
It's possible... but the tails of distributions do exist in actuality. Assuming that a large measurement is a goof isn't statistically sound either, unless you have a very large number of measurements and can confidently identify aberrations. Particularly if it's not normally distributed. Lognormals have extremely long right-hand tails, and a lot of the data that I work with is lognormally distributed. If I were to throw out really large data points on the assumption that they were measurement goofs, I would bias my results.
This is a point that students often get wrong: outliers deserve to be checked (not statistically, but methodologically), but one cannot just drop them because they seem odd (even if they have a lot of leverage).

Peez
 
I have taken statistics course and use it every day. Calculating standard deviation from 5 measurements is perfectly fine and is done everyday.
I don't want to integrate to calculate standard deviation of standard deviation but I can tell you it's not worse than 50%.
Even 2 measurements SD is better than nothing, it gives some sense of the errors involved as opposed none whatsoever.
You two (Emily Lake and Pechtel) have no fucking clue.
 
Last edited:
Emily Lake:
It's possible... but the tails of distributions do exist in actuality. Assuming that a large measurement is a goof isn't statistically sound either, unless you have a very large number of measurements and can confidently identify aberrations. Particularly if it's not normally distributed. Lognormals have extremely long right-hand tails, and a lot of the data that I work with is lognormally distributed. If I were to throw out really large data points on the assumption that they were measurement goofs, I would bias my results.
This is a point that students often get wrong: outliers deserve to be checked (not statistically, but methodologically), but one cannot just drop them because they seem odd (even if they have a lot of leverage).

Peez

Yes, and real/direct measurements like the one with voltmeter/ruler/scale don't have normal distributions, they have no tails so if there is a outliers then it means someone made a typo or something else went wrong.

And lognormal distributions are never associated with measuring apparatus itself, it's an intrinsic property of the the measured system, not the apparatus.
 
Last edited:
I have taken statistics course and use it every day. Calculating standard deviation from 5 measurements is perfectly fine and is done everyday.
I don't want to integrate to calculate standard deviation of standard deviation but I can tell you it's not worse than 50%.
Even 2 measurements SD is better than nothing, it gives some sense of the errors involved as opposed none whatsoever.
You two (Emily Lake and Pechtel) have no fucking clue.

If I If you are making a statistical inference it is meaningless without a stated confidence interval or level. You take 5 samples and compute mean and SD, what is the two sided 90% confidence interval of the sample mean?
 
Take a few data points, calculate average and standard deviation. Common practice and useful to make a simple assessment. However 5 data points do not tell you anything about about what is going on. In an experiment the goal is to estimate the true value of some parameter.

Mathematically from maximum livelihood estimators the best estimator or expected value for a normal distribution is the arithmetic mean. It is not necessarily true for all distributions. For a normal distribution the arithmetic mean is the best estimator of the actual value.

So, taking 5 data points and computing average and SD knowing nothing more is called distribution free or non parametric methods. It means you look at data and try to make sense out of it.

There is small sample and large sample theory, and the obituary is roughly between 10 and 20 samples. I have seen it born out in actual analysis and it can be demonstrated by simulation. If you have a large data set take the first two points and average, then the first three and so on. As N gets large the sample means vary about the true mean by smaller deviations.

From experience I go with 20 as a min sample size. With that I can do a histogram and cumulative distribution to look for an underlying distribution.

When you are in the large sample region the Central Limit Theorem applies. It says that regardless of any underlying distribution random sample means will be normally distributed. It is the basis of practical statistics,. For random sampling parameters tend to be approximated by normal distributions.

For small samples I use probability plotting. 5 data plots makes for a straight line on a plot. I plot the ordered data points vs median ranks. If the least squares line looks good on the plot estimates of the mean and standard deviation can be read. In an old incarnation as a reliability engineer I used Weibul plots.

In one case I had 5 or 6 sample parts from a manufacturer. To estimate the variability of a parameter I used a probability plot.

There is a lot you can do with 5 data points depending on what you are trying to do and the situation.


In an experiment like the paper an error estimate can be complicated. The variability in a number of test runs does not tell you accuracy or resolution. Some error sources are added algebraically and some are added Root Sum Square. And which is which can be a source of contention.

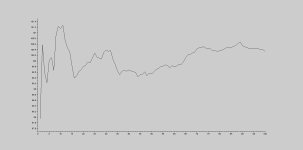
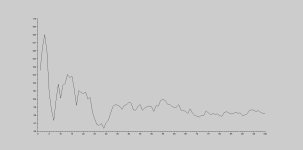
Following is Sciab script. Given a random vector of a normal distribution, compute sample means for the first two samples, the first three samples and so on. Vary the standard deviation and see how many samples are needed before for the sample mean to converge on the true mean.

//////////////////////////////////////
clear;

n_points = 1000;
_mean = 100;
stand_dev = 2;

r = grand(1,n_points,"nor",_mean,stand_dev);

_index = 1;

for i = 1:100;
_sum = 0;
n = 0;
for j = 1:_index;
n = n + 1;
_sum = _sum + r(i + j);
end
samp_mean(1,j) = j;
samp_mean(2,j) = _sum/n;
sm(j) = _sum/n;
_index = _index + 1;

end

figure(1);
histplot(20,r)

figure(2);
plot2d(sm);

mean(r) // true mean

samp_mean

////////////////////////////////////////////////////////////////////

Y sample means, X number of samples. Mean 100, standard deviations of 2 followed by 10.

SD-2.jpeg


SD-10.jpeg
 
The reality is that sometimes you shouldn't do the math.

And that 110 is more likely a measurement goof than random error anyway.

It's possible... but the tails of distributions do exist in actuality. Assuming that a large measurement is a goof isn't statistically sound either, unless you have a very large number of measurements and can confidently identify aberrations. Particularly if it's not normally distributed. Lognormals have extremely long right-hand tails, and a lot of the data that I work with is lognormally distributed. If I were to throw out really large data points on the assumption that they were measurement goofs, I would bias my results.

Spoken like a true experimentalist. Are you Boeing?
 
steve_bnk:
Take a few data points, calculate average and standard deviation. Common practice and useful to make a simple assessment. However 5 data points do not tell you anything about about what is going on. In an experiment the goal is to estimate the true value of some parameter.

Mathematically from maximum livelihood estimators the best estimator or expected value for a normal distribution is the arithmetic mean. It is not necessarily true for all distributions. For a normal distribution the arithmetic mean is the best estimator of the actual value.

So, taking 5 data points and computing average and SD knowing nothing more is called distribution free or non parametric methods. It means you look at data and try to make sense out of it.

There is small sample and large sample theory, and the obituary is roughly between 10 and 20 samples. I have seen it born out in actual analysis and it can be demonstrated by simulation. If you have a large data set take the first two points and average, then the first three and so on. As N gets large the sample means vary about the true mean by smaller deviations.

From experience I go with 20 as a min sample size. With that I can do a histogram and cumulative distribution to look for an underlying distribution.

When you are in the large sample region the Central Limit Theorem applies. It says that regardless of any underlying distribution random sample means will be normally distributed. It is the basis of practical statistics,. For random sampling parameters tend to be approximated by normal distributions.

For small samples I use probability plotting. 5 data plots makes for a straight line on a plot. I plot the ordered data points vs median ranks. If the least squares line looks good on the plot estimates of the mean and standard deviation can be read. In an old incarnation as a reliability engineer I used Weibul plots.

In one case I had 5 or 6 sample parts from a manufacturer. To estimate the variability of a parameter I used a probability plot.

There is a lot you can do with 5 data points depending on what you are trying to do and the situation.


In an experiment like the paper an error estimate can be complicated. The variability in a number of test runs does not tell you accuracy or resolution. Some error sources are added algebraically and some are added Root Sum Square. And which is which can be a source of contention.

Following is Sciab script. Given a random vector of a normal distribution, compute sample means for the first two samples, the first three samples and so on. Vary the standard deviation and see how many samples are needed before for the sample mean to converge on the true mean.

//////////////////////////////////////
clear;

n_points = 1000;
_mean = 100;
stand_dev = 2;

r = grand(1,n_points,"nor",_mean,stand_dev);

_index = 1;

for i = 1:100;
_sum = 0;
n = 0;
for j = 1:_index;
n = n + 1;
_sum = _sum + r(i + j);
end
samp_mean(1,j) = j;
samp_mean(2,j) = _sum/n;
sm(j) = _sum/n;
_index = _index + 1;

end

figure(1);
histplot(20,r)

figure(2);
plot2d(sm);

mean(r) // true mean

samp_mean

////////////////////////////////////////////////////////////////////

Y sample means, X number of samples. Mean 100, standard deviations of 2 followed by 10.

View attachment 850


View attachment 851
Good post, but I could not help chuckling about the "maximum livelihood estimators". :)

Peez

Thanks, but why the chuckle...basic theory. I think most people use the arithmetic mean as an estimator without knowing why it it is a good estimator.

For me the op is an opportunity to do a review of things I have not looked at in a while.
 
You are missing the point. Any estimate is open to error (otherwise it would not be an estimate), that does not absolve one of the responsibility of reporting it. Note that we are not just reporting the sample SD as an estimate of the population SD, we are reporting it to characterize the sample. More importantly, the mean is just as open to error as is the variance. Just look at the example you gave: exactly how meaningful is the mean of 29.2? None of the observed values was anywhere near the mean. If we were told just the mean, we would have no way of knowing how likely it is that a second sample of the same size would be similar. However, if we are told the mean of 29.2 and the SD of 45.8 then we would know that a second estimate could easily be quite different. Your own example shows just how important it is to report an estimate of variance.

Compare that to a different data set with the same mean: {25, 27, 28, 30, 36}. Here the SD is 4.2. This tells the informed reader something important about that sample.

No more than it "would be statistically irresponsible of them to calculate" means "from a sample size that small". In fact I consider it "statistically irresponsible" to report the mean without any estimate of variability.

Peez

If you read the paper, what NASA did was to report the mean, the range of measurements, and the number of measurements. So for example, they would have reported: mean 29.2, range (1-110), # of measurements 5.

Which certainly indicates whether or not there's any degree of consistency in their measurements... but also avoids giving the false impression of statistical validity and rigor where none exists.

- - - Updated - - -

Emily Lake:
Not with any credibility. Have you never taken a statistics course? In my opinion it's worse to imply credibility where there is none, than to omit a calculation that would be non-credible. You're insisting that they include a number that is both meaningless and misleading simply for the sake of form?
A sample size of 5 is not large, for a mean or a variance, and a sample size of 2 is not normally something that should be analyzed at all. However, if a mean can be meaningfully calculated then an estimate of variability should be reported with it. In case it makes any different, I have taught statistics.

Peez

Would you advise your students to report mean and variance if doing so would imply that there is a statistically credible sample set when there is not one? If doing so would be materially misleading?
 
Spoken like a true experimentalist. Are you Boeing?
Nope. Much of what I work with is survey data, some of it is health-related data, which has a really long tail. I am still a newb with a good chunk of what I'm doing.

- - - Updated - - -

Good post, but I could not help chuckling about the "maximum livelihood estimators". :)

Peez

Thanks, but why the chuckle...basic theory. I think most people use the arithmetic mean as an estimator without knowing why it it is a good estimator.

For me the op is an opportunity to do a review of things I have not looked at in a while.

Those lively, lively statistics! So much fun to hang out with ;)

A girl who likes statistics...thumpity thump thump...be still my heart.
 
A girl who likes statistics...thumpity thump thump...be still my heart.

To be honest, it started out as applied mathematics. The statistics was a side effect of drifting off kilter into a bunch of survey and consumer-research related stuff. So now I'm having to dig into my memory banks and pull out the stuff I learned x years ago, as well as doing a lot of self study. But it's fun! I get to learn about cluster analysis and predictive modeling paired with survey design and sampling theory and research methodology!

I have enough sense to get out of my own way, and I usually avoid making disastrous errors... I know what I don't know ;) But I don't know it yet, and it's certainly not at the level of intuition yet. Luckily I'm pretty good at problem solving and abstract thinking, which helps a lot. I can usually see what's not going to work... and I can usually figure out where to go to find out what will. Beyond that, it's me, my colleagues, and a bunch of books and data.

But I love data, so that's all good!
 
steve_bnk:
Thanks, but why the chuckle...basic theory. I think most people use the arithmetic mean as an estimator without knowing why it it is a good estimator.
I presume that you meant maximum likelihood estimators, though perhaps your statistical analyses are more "lively" than mine.
:)
Peez
 
Emily Lake:
Would you advise your students to report mean and variance if doing so would imply that there is a statistically credible sample set when there is not one? If doing so would be materially misleading?
Did you stop beating your husband?

If one is going to report a mean, there are two other things that should be reported (at a minimum): an estimate of variability and the sample size. From these the informed reader may make their own determination of how credible the mean is. Without either one they cannot. Simply reporting a variance does not imply that a sample set is "credible" any more than reporting the mean does. Also, I have not suggested that the variance needs to be reported. I have been very carefully to state that an estimate of variability must be reported (the range is an estimate of variability). I note that you failed to address my point about the example you provided.

Peez


I don't see why you think this is a husband beating situation. I think it was a valid question, please allow me to elaborate.

Yes, your case is true, if the sample size is large enough to be reasonable and the distribution is normal. Then reporting mean and variance allows the reader to make some estimate of whether the sample is credible.

I think, however, that there is a difference that should be considered when the sample size is small. I'm getting into things that I can envision, but I may not be articulating well. Some of the stuff I work with is in trying to determine whether or not a correlation exists - whether there is a distribution at all, or whether it is random. With a small sample, I can calculate mean and variance, sure. But if I get a high variance, I can't necessarily tell if the small sample I have contains a legitimate low probability tail measurement, or if it is random and indicative of low correlation. If I report the mean and variance in a small sample, someone in my not-so-informed audience is going to assume that because I've reported statistical measures, that the results must therefore be robust and credible. Simply the fact that I've reported statistics means that statistics are credible to that audience.

You as an actual statistician might have more sense... but they don't, and I think that many readers don't. I try very hard to never imply more credibility or certainty than I actually have. There've been times where my caveats are longer than my material!

That was the basis of my question. How would you advise your students for situations like that? I'm genuinely curious what your take is on it.

In regard to having failed to address your point, I'm sorry. I'm not entirely sure what point you feel I missed. If you tell me again, I'll endeavor to address it.
 
Nope. Much of what I work with is survey data, some of it is health-related data, which has a really long tail. I am still a newb with a good chunk of what I'm doing.

- - - Updated - - -

Good post, but I could not help chuckling about the "maximum livelihood estimators". :)

Peez

Thanks, but why the chuckle...basic theory. I think most people use the arithmetic mean as an estimator without knowing why it it is a good estimator.

For me the op is an opportunity to do a review of things I have not looked at in a while.

Those lively, lively statistics! So much fun to hang out with ;)

I did not see it, with my yes I sometimes click on the wrong selection from the spell checker.
 
Back
Top Bottom