• Welcome to the new Internet Infidels Discussion Board, formerly Talk Freethought.

The World-O-Meter Thread

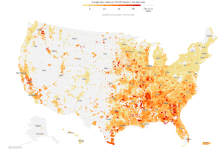
And while I am here, here is the current US snapshot.
View attachment 29043

We are certainly trending in the right direction!

Amazing how the curve turned down when it was turned over to a crony rather than the CDC.

I think "the numbers" were already bent to Trump's will at the State level, so taking the accounting away from the CDC was more to prevent the discovery and rectification of the suppression that was already going on than to institute more ways to lower the counts without addressing the problem. Could be both, though.

About 30% of COVID deaths may not be classified as such

Early on, "In several states, the deaths occurred before the availability of COVID-19 diagnostic tests and thus weren't counted as coronavirus deaths. The estimated number of excess deaths varied significantly among states."
Since that time, there has been pressure to assign cause of death to comorbidity factors in states like FL and TX, but the overall variance between "excess deaths" and COVID-reported deaths hasn't greatly expanded.

The only yardstick that's worthwhile is excess deaths.
 
The only yardstick that's worthwhile is excess deaths.

At this point I have no choice but to agree. But it is a dynamic situation.
Here's something to chew on; maybe we will get a little something back from the horrific price we have already paid:

Is herd immunity ahead of schedule?

In the early days of the crisis, scientists estimated that perhaps 70 percent of the population would need to be immune in this way to be free from large outbreaks. But over the past few weeks, more than a dozen scientists told me they now felt comfortable saying that herd immunity probably lies from 45 percent to 50 percent.
 
Yup ...at the moment.
Still killing 1000+ people every day.
You really are a glass-half-empty guy. Yes, the pandemic is still going strong. But there are encouraging signs that it is turning around. Not over by a long shot, but things are looking better.

That should trend down in a few weeks too. But there are still too many FOXwashed morons out there who "don't believe in" pandemics to assure that another peak (possibly even worse than this most recent one, even as this one is much worse than the one in April) isn't lurking around the corner.
I do not think we are heading into a worse peak than the current one (1b). There will probably not even be an identifiable peak. Just a bumpy downslope throughout Fall and Winter.

The March/April peak (1a) was certainly worse than the one we just passed (1b) even though raw numbers were lower. 1a mostly hit the Northeast and was pretty much a blimp in most other areas, with the exceptions of some hotspots (Washington State nursing homes, Albany Ga and a few others). 1b hit the rest of the country, at least more populated areas, which means higher numbers but much more diffuse impact. Secondly, we have more testing now than in March/April so the numbers capture more of the true count. According to Worldometer, Georgia (23,918/M) has just passed NY (23,662/M) with regard to per capita cumulative cases, but I do not think that is close to reflecting reality.

With no encouragement of vigilance coming from the Trump Crime Family and their minions, it seems almost inevitable.
Yeah, Trump fucked up the COVID response royally. Nothing I write here is meant to exonerate Trump. But he is one lucky motherfucker in that the pandemic is turning around and it could have been much worse.

The most encouraging thing is the NY map - it shows that antibodies are enduring long enough in large fractions of the population to confer a degree of "herd immunity", and that exposure to the Trump Virus is far more widespread than reports would indicate (so mortality rates are much lower than shown by report-based calculus).
Indeed. One note though - circulating antiboddies are not necessary for immunity. After antibodies have decayed, which happens (you don't want to have significant antibodies to every antigen that ever provoked immune response in your blood anyway) over time, adaptive immunity is maintained via memory B and T cells. B cells are the ones that produce antibodies.

So depending on the sensitivity of the antibody tests, the number of people who are already immune could be even higher.
 
I'm wondering how the numbers can be trusted since the feds have placed handling those numbers into the hands of political flunkies.

The numbers come from the counties on the ground, not from the Feds. That's how for example NY Times can compile maps like this one.
usmap.png
 
Anything to justify sacrificing a million people on the altar of the DOW.
Who is justifying anything? I am just relaying information that things may be better than many people think.

Even if a few of the hardest hit spots are at herd immunity that doesn't mean the rest of the nation is.
True. But the rest of country is right behind NY as it were.
 
There is a growing group of scientists who warn that we may never able to develop herd immunity.
Is there? I guess [citation needed] for that. It directly contradicts the article I posted, where scientists think herd immunity can be achieved with much less than the initially assumed 70%.

IOW, the upcoming vaccine will only be around 30% effective,
[citation needed] for that as well. Especially since there are several vaccine candidates in clinical trials as we speak.
And in any case, vaccine is one way to confer immunity. Old-fashioned exposure is another. And parts of the country, such as NYC, may already be close to herd immunity.

Note also that even if the vaccine is partially effective, it still helps. As does previous exposure to other Coronaviruses.
 
The numbers come from the counties on the ground, not from the Feds.

Good thing no feds come from any counties. Or States. That way no county or State officials can be enticed to "play ball", be threatened by or be tempted by anyone to whom they report.

Except a few bad apples like this woman who said she was fired from the Florida Health Department for refusing to alter coronavirus statistics and is now publishing data on her own.

(article from June - HERE is what she is doing today.)
 
Anything to justify sacrificing a million people on the altar of the DOW.
Who is justifying anything? I am just relaying information that things may be better than many people think.

Even if a few of the hardest hit spots are at herd immunity that doesn't mean the rest of the nation is.
True. But the rest of country is right behind NY as it were.

I'm not saying you're trying to sacrifice people, I'm saying you're repeating the propaganda by those who are trying to.
 
Amazing how the curve turned down when it was turned over to a crony rather than the CDC.
The data comes from individual counties. It has nothing to do with any "cronies".
The reason it is turning around is that saturation effects are kicking in. It is the expected shape an epidemic curve takes. Of course you and other conspiracy theorists will claim that the conspirators know this and deliberately made the curve verisimilitudinous ...
 
Early on, "In several states, the deaths occurred before the availability of COVID-19 diagnostic tests and thus weren't counted as coronavirus deaths. The estimated number of excess deaths varied significantly among states."
Since that time, there has been pressure to assign cause of death to comorbidity factors in states like FL and TX, but the overall variance between "excess deaths" and COVID-reported deaths hasn't greatly expanded.

Note the "may" in your title. Also, if the difference between reported deaths and estimates of "excess deaths" has not significantly expanded, then the curve shape is largely correct, right, despite your conspiracy theories.
 
The only yardstick that's worthwhile is excess deaths.
I would not say it is the only "worthwhile" yardstick, but it has the advantage of capturing things that are not directly related to the disease, such as people avoiding going to the hospital. However, "excess deaths" is a statistical estimate as we cannot know for sure how many deaths we would have had otherwise. There are also factors that go the other way. Less traffic - fewer car accident deaths for example.
 
The only yardstick that's worthwhile is excess deaths.

At this point I have no choice but to agree. But it is a dynamic situation.
Here's something to chew on; maybe we will get a little something back from the horrific price we have already paid:

Is herd immunity ahead of schedule?

In the early days of the crisis, scientists estimated that perhaps 70 percent of the population would need to be immune in this way to be free from large outbreaks. But over the past few weeks, more than a dozen scientists told me they now felt comfortable saying that herd immunity probably lies from 45 percent to 50 percent.

Yeah, that's the article I posted upthread a little while ago.
 
The numbers come from the counties on the ground, not from the Feds.

Good thing no feds come from any counties. Or States. That way no county or State officials can be enticed to "play ball", be threatened by or be tempted by anyone to whom they report.

Except a few bad apples like this woman who said she was fired from the Florida Health Department for refusing to alter coronavirus statistics and is now publishing data on her own.

(article from June - HERE is what she is doing today.)

How do her numbers compare with the official ones. Especially: is there any evidence there hasn't been a reduction in new cases since the beginning of August?
 
I'm not saying you're trying to sacrifice people, I'm saying you're repeating the propaganda by those who are trying to.

I am not "repeating" anybody's "propaganda". I am posting case numbers that we have as well as articles places such as NY Times. Just because they do not fit your "sky is falling" point of view does not make them propaganda.
 
The only yardstick that's worthwhile is excess deaths.
I would not say it is the only "worthwhile" yardstick, but it has the advantage of capturing things that are not directly related to the disease, such as people avoiding going to the hospital. However, "excess deaths" is a statistical estimate as we cannot know for sure how many deaths we would have had otherwise. There are also factors that go the other way. Less traffic - fewer car accident deaths for example.

There have been many reports of efforts to undercount Covid cases even at the hospital level. I do agree that excess deaths aren't a perfect yardstick but given how untrustworthy the proper one is it's all we have.
 
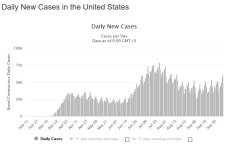
And then this happens, as I predicted:

[graph showing daily cases increasing, but alas, with no 7 day average to smooth out noise]

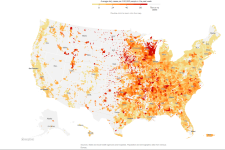
Indeed, there has been a recent increase to just under 50k/d (7 day average). This current proto-wavelet (call it 1c?) seems to be driven mostly by rural areas that have not been hard hit in waves 1a (Northeast, esp. NY and some other areas like parts of Washington State and SF Bay area) or 1b (most of the rest of the country, esp. urban and suburban areas resulting in a much higher daily case peak but interestingly a lower daily deaths peak than 1a).

Look at this map from NY Times.
The heat map is the 7 day average of daily cases per 100,000 of population, granular by county. Grey does not mean no Corona but hardly any people (<10/mi2).
uscases.png

Red means >56 cases per day per 100,000. These red counties look mostly rural. Look at Wisconsin. Pretty much the entire NE portion of the state is lit up red like an Amsterdam whorehouse! But that is also the more rural part of the state. Except probably only for the city of Green Bay itself.

Anyway, NE Wisconsin has been reporting high number of cases for several weeks now. The case count should most likely be coming down into the oranges within a week or two for most NE Wisconsin counties, as most of people most likely to contract the disease actually do so.
 
Last edited by a moderator:
Back
Top Bottom