I, for one, think the breakdown by state is a bit arbitrarily defined in order for people to make partisan claims. Then, other people get caught up in believing there is something partisan going on or outcomes based on partisan differences. That is, people will assume, "hey let's correct this or estimate that based on red state or blue state loss or gain of population."
So let me play Devil's Advocate for a moment to see if I can explain some problems with this oversimplification. As a thought experiment, imagine we observe racial differences in overcounting and undercounting. Black people were undercounted and white people were overcounted. Then, I say, "See, look? The system is rigged. Black people traditionally vote Democrat and White people more often vote Republican. So let's estimate those contributions back to those party seats in Congress." Wouldn't you think there was a certain kind of lack of granularity and maybe too much of a generalization, at least among white voters to do the estimations with good confidence?
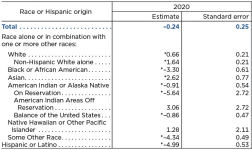
Well, it turns out that what I wrote is true. Black people WERE undercounted. And White people WERE overcounted. But now if I told you this and said nothing else, I'd be cherry-picking the dimensions that are different. Perhaps to make a point or perhaps because it's significant or maybe to support my own narrative.
While you may find this very interesting that both these things could be true that Blacks are undercounted and red states are undercounted, we probably should just stop and consider things one level deeper and try to recollect events surrounding the 2020 census enumeration.
So, first, next level of depth here..more granularity. Many states are not blue or red but purple, but moreover, we can break it down by county and note that urban areas in particular are typically more blue, and rural areas are typically more red. Of course, there are regional differences as well such as by state. I bring this up because if you go through the documentation on the PES you will find that they did not break it down by county for observers and so we cannot tell if it was the urban areas of Texas (for example) that were undercounted that then would be far less reflective of a partisan undercount.
Let's table this for a moment and get back to it.
Next, some recollections. The 2020 census was a shitshow. Trump wanted to ask for a bunch of info from residents and given his right-wing schtick and xenophobia, there was an argument from Democrats that this would scare the bejeebus out of immigrants, even legal immigrants from participating in the census. We also were going through lockdowns and the pandemic. The census is around April 1st and we were certainly knee-deep in the shite by then. There was probably a rush job to "get er done" by a Republican administration which we all know is pretty shitty at government. Take all these factors and how they played out differently across regions in the US and add one more: this was the first census year with a heavy digital component to data entry by households and you have a recipe for complete and utter failure and chaos.
Okay, now let's go back to what we tabled, county differences in Texas and urban areas. Consider the following scenario: you're a legal immigrant worker living in Houston commuting to work, you're scared by the right-wing crazies and Trumpophiles, and English is not your forte--you get by on a day-to-day basis and you are learning and you do not have a laptop to try to enter data into a census survey anyway. While you do not vote because you are not a citizen, the representative for your district is a Democrat. You are too scared to do the census and so you ignore the whole thing. Maybe later on you might answer questions under a more friendly administration.
That's some granularity---now would you consider it fair to say, "Hey this guy is from a red state, so let's assume that there are missing Republican seats on his behalf?"
Do note that immigrants are often in urban areas and this is a thing that happens in Texas. Also, it turns out that Hispanics were another undercounted demographic:

To add...
So the methodology of the PES is that they choose 10,000 blocks in the US to sample people from and then they interview them to ask where they were living April 1st, 2020 and maybe also ask about other residents. Those interviews went up to March 2022. It took a long time for them to sample these 10,000 blocks in the US. They then used this for their estimate.
But now this isn't a primary source of documentation for 2020 because it is people's memories which may be wrong. If it includes info on other people, it seems it could be more wrong...but then there's also an issue of subjectivity in terms of how does a residence get reflected for people who migrate or have dual residence but it was the middle of a pandemic. Do you consider your typical residence your residence if it is usually your primary but not this year because of the pandemic, etc?
So, perhaps, this is why there were a number of overcounts in New England and NY who have some subpopulations that have dual residence in Florida.
How they are counted from either the census or the post enumeration survey may be inconsistent or the memory may not reflect the subjectivity of the time (or whatever).
Overall, I think if you do not get to the bottom of the root causes of differences between the census and PE survey, you should not assume one or the other measurement is better than the other or try to correct the former based on a superficial trend of partisan estimations.


