• Welcome to the new Internet Infidels Discussion Board, formerly Talk Freethought.

We are overloading the planet: Now What?


If we can provide for our needs and wants without perpetual growth, aka Adam Smith, et al, how much more and more and more do we want need? Five houses each? Ten cars? Not enough, we need to keep adding more and perpetual growth is the key?
How about more efficient houses and smarter transit systems inatead of just more of the same old crap?

A steady state economy doesn't exclude living well, innovation, efficiency or progress in science. It just excludes the notion of perpetual growth in population and exploitation of natural resources, which, given a finite world that we have alreading overburdened, is a Ponzi scheme heading for disaster.
1) If you have progress in science you do not have a steady state economy.

2) Even if it is stable you're still mining resources. That's not infinite. We aren't going to suddenly run out of something but the effort required to obtain things will increase--and such effort is no longer available for maintaining our standard of living. Eventually a point will be reached where there is negative output.

The Greens have this utterly unrealistic view of small technology that by some magical means has no resource inputs.

Progress in understanding the natural world is achieved through research, observation and testing. A steady state economy doesn't exclude allocating funds for scientific research. It just excludes perpetual growth in population, economic growth and consumption, which is impossible in any case: Adam Smith, et al.
If you apply anything you learn from that science the economy is no longer steady state.

That's an odd assertion. The point of new technology is that it can provide a more efficient system, doing things better and using less energy. Building a better understanding of the natural world doesn't require using more and more resources, just a constant allocation of funds for research.
 
It's not about the graphs.
It is, though. You presented a period of accelerating growth as a flat line ("roughly steady state") because of the scale of the graph.

I made no mention of a flat line. I said 'roughly' a steady because it isn't a straight line, however it took many thousands of years for us to get to a billion, after which we see an unprecedented spike in numbers. That was the point, not that there was a modest rate growth after the ice age and advent of farming, towns and cities. Under one billion for all of our history is hardly to be compared to eight billion and growing in current times.
In other words, you thought the line was "roughly" flat, sorry, "roughly steady".
That's an odd assertion. The point of new technology is that it can provide a more efficient system, doing things better and using less energy. Building a better understanding of the natural world doesn't require using more and more resources, just a constant allocation of funds for research.
The point of new technology is to increase the amount of work that we do and usually means we use more energy, not less.

And I'm pretty sure new and more powerful telescopes do require more and more resources.
 
Modern agriculture and grans bred to survive in relative poor environments.

Beef consumption on a large scale began in the 19th century.
 
It's not about the graphs.
It is, though. You presented a period of accelerating growth as a flat line ("roughly steady state") because of the scale of the graph.

I made no mention of a flat line. I said 'roughly' a steady because it isn't a straight line, however it took many thousands of years for us to get to a billion, after which we see an unprecedented spike in numbers. That was the point, not that there was a modest rate growth after the ice age and advent of farming, towns and cities. Under one billion for all of our history is hardly to be compared to eight billion and growing in current times.

The graph does show a sharp story. The difference (or ratio) between 1 billion and 8 billion people is HUGE. Much huger than the relationship between 100 million and 800 million BECAUSE the 8 billion figure approaches the maximum carrying capacity of the planet; and is several times the maximum SUSTAINABLE carrying capacity. The linear y-axis does emphasize the sudden huge boom in numbers.

But most of us at IIDB already are quite familiar with the basic population facts, and the emotion-jerking is unnecessary. My interest in the graph was UNRELATED to thread topic -- as a layman interested in human prehistory I am curious about growing population during the Stone Age. I merely pointed out that the data estimates used for that graph made no attempt to reflect interesting and relevant history and prehistory.
 
There's also the issue that the survivors of most any modern catastrophe will have to recover without any land mammals. They'll all go extinct as the ravenous hordes eat anything they can.
Seriously? You think that in the aftermath of a catastrophe the surviving humans will out breed and out eat the rats?

No way, Jose.

I seriously doubt that your ravening hordes could even drive livestock such as sheep, goats, cows, pigs, or horses to extinction.

Shit, in Australia, we still have somewhere in the order of one feral pig per human, despite concerted attempts to eradicate them using the best modern technology we can muster. A few starving city gents fresh from the boardroom and armed only with sharp sticks aren't going to make a dent in their numbers.

You should try catching a goat sometime. I bet you can't, even if (indeed, particularly if) you are starving.
 
I just looked over the Forbes 25 list--while some started from a decent position their vast wealth is mostly self-made.
Nah, it's made on the back of first world infrastructure. Otherwise we would see as many Nigerians on the list as Americans.

Or are you of the opinion that Nigerians don't make the list because they don't work as hard, or don't have as much ambition as, Americans?
 
https://ourworldindata.org/grapher/population lets you generate graphs with endpoints before today.
I like graphs! Three comments about this one.
  • Click Settings, then Logarithmic. It is silly to try to use a graph like this with the y-axis set to Linear.
  • The graph shows that Europe's growth rate increased about 1700 AD and again about 1800 AD. However this data appears to be just crude interpolation. For example, the early 1940's had a higher-than-normal death rate and a lower-than-normal birth rate, with the numbers much more than large enough to appear on this graph. Instead ... nothing.
  • I will guess that the data before about "0" AD is complete nonsense, gibberish. Just glancing at it, it appears they drew a straight-line (logarithmic) between numbers for 10,000 BC and "0" AD. In fact, prehistory was more interesting: There were huge surges in population associated with certain events, especially the advent of farming, and the "secondary products revolution."
Linear makes sense for what he's showing.
Only if your aim is to engender needless fear.
Log is useful for scientific purposes but the average person generally won't understand.
The whole point is to frighten people. Understanding gets in the way of that.

"Scientific purposes" is another way of saying "to inform people".
 
I said 'roughly' a steady because it isn't a straight line, however it took many thousands of years for us to get to a billion, after which we see an unprecedented spike in numbers. That was the point, not that there was a modest rate growth after the ice age and advent of farming, towns and cities.
Well you're right there. There was an exponential rate of growth. It wasn't "modest" at all.

It looks the same at every point. Your completely arbitrary "scare point" of one billion is no less arbitrary than one million, or ten million, or a hundred million. At each of those milestones, it was also true that "it took many thousands of years" to get there, and then we got to twice (or eight times) that number very quickly.

WRONG. Perhaps YOU need to look at that graph again, whether linear or logarithmic. It took 6000 years for the population to grow from 10 million to 100 million and almost another 3000 years for the population to grow to 1 billion. The most recent ten-fold increase took only 260 years.
 
I said 'roughly' a steady because it isn't a straight line, however it took many thousands of years for us to get to a billion, after which we see an unprecedented spike in numbers. That was the point, not that there was a modest rate growth after the ice age and advent of farming, towns and cities.
Well you're right there. There was an exponential rate of growth. It wasn't "modest" at all.

It remained under one billion for our entire existence, until recent times, the industrial revolution. Under one billion for ten thousand years if you count from end of the ice age is hardly exponential growth. Over our entire existence as a species, it's not much at all. Farming and urbanization enabled a higher population and the industrial revolution gave it an unprecedented boost, which is still in progress.

There is no comparison to be made between a population that remained well under one billion over the entire course of our existence, and the spike we experienced during industrial times.

That is the issue.


It looks the same at every point. Your completely arbitrary "scare point" of one billion is no less arbitrary than one million, or ten million, or a hundred million. At each of those milestones, it was also true that "it took many thousands of years" to get there, and then we got to twice (or eight times) that number very quickly.


It's not that it's a 'scare point,' but a question of 'is it sustainable?' Given numerous studies that point to overshoot, it appears that our way of doing business and our consumption rate in developed nations, the answer appears to be 'no it is not sustainable in the long term.'
 

LOL! I shared a peer-reviewed paper with you that argued that we needed to limit consumption. That paper referenced multiple peer-reviewed papers that said the same thing. Yes, peer-reviewed papers are sometimes wrong, and you have the right to dispute them. But how can you tell us that you not only refuse to accept the conclusion of this article, but you refuse to accept it is even possible, and refuse to accept it is even plausible?
The problem you have yet to address is consumption of what?

Limiting consumption of renewable resources to their production rate makes sense. However, most resource consumption is of things that are only renewed on a geological time scale if that. There is no meaningful production to balance it against.
I deal with both the consumption of renewables and non-renewables.

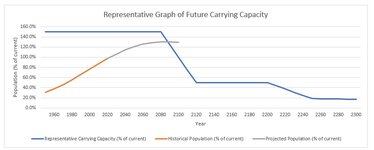
In the schematic graph below, I show two dips in carrying capacity. The first dip deals with the constant stress we are putting on renewable resources--such as fish and forests--as well as environmental damage beyond what the Earth can absorb--such as CO2 emissions, fertilizer runoff and loss of species. This is overshoot. And sustained overshoot overwhelms the planet, and will deteriorate the ability of the planet to hold a large population.

Per the Global Footprint Network, it would now take 1.75 Earths to sustain us at current consumption rates, and that number keeps growing. With continued trashing of the planet the capacity of the Earth deteriorates. Hence, I estimate that we may need to cut our consumption in half in the next 100 years or face serious consequences. If technology increases do little more than balance out future affluence increases, then the only way to reduce that negative impact is a reduction in population.

The second dip refers to loss of renewable resources, such as fossil fuels and minerals. These don't get renewed at any rate close to current consumption. And no, we will not simply recycle these minerals forever. Some minerals cannot be recycled at all, and others deteriorate with recycling. (Michaux, Simon P., 2021, The Mining of Minerals and the Limits to Growth., Geological Survey of Finland; Michaux, Simon P., 2021a, Restructuring the Circular Economy into the Resource Balanced Economy., Geological Survey of Finland.; B, 2024, Death Cults, Doomers and an End of a Civilization, Medium)

I show a representative value of the second dip at 20% of the current carrying capacity. I think you put this dip much lower, and perhaps further out in time.

This graph changes completely depending on population, levels of affluence, and technology in use in the coming decades. I describe all this at https://mindsetfree.blog/we-are-overloading-the-planet-now-what/#Overshoot.

And no, Bilby, I am not saying these are the exact figures. As I describe in my writeup, they are representative of the two dips that Loren says I do not account for. I do indeed account for them.

And by the way, the grey curve is the middle UN projection of future population, something which people think they need to endlessly remind me of, even though I already include that in my paper.


safe zone Screenshot 2023-12-18 185306.jpg
 
Well you're right there. There was an exponential rate of growth. It wasn't "modest" at all.

It looks the same at every point. Your completely arbitrary "scare point" of one billion is no less arbitrary than one million, or ten million, or a hundred million. At each of those milestones, it was also true that "it took many thousands of years" to get there, and then we got to twice (or eight times) that number very quickly.

WRONG. Perhaps YOU need to look at that graph again, whether linear or logarithmic. It took 6000 years for the population to grow from 10 million to 100 million and almost another 3000 years for the population to grow to 1 billion. The most recent ten-fold increase took only 260 years.

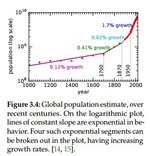
Population growth since industrial times has been on steroids. In the 20th century, the exponential growth increased at a much faster rate, mainly due to fossil fuels. Not only did population rise, but the affluence level of that population also rose, leading to what Thomas Murphy refers to as a death by hockey sticks.

murphy population Screenshot 2024-02-06 071439.jpg
Source: Murphy, Thomas W. Jr. 2021, Energy and Human Ambition on a Finite Planet , eScholarship
 
Source: Murphy, Thomas W. Jr. 2021, Energy and Human Ambition on a Finite Planet , eScholarship

I've clicked TWO of your links so far, Merle. The first (six out of nine risk thresholds exceeded) seemed OK although I wasn't fond of their arithmetic. I hoped that the Deniers would devote at least a few sentences to a rebuttal.

The second link I clicked was just now, the Thomas Murphy treatise. My advice is that you remove all references to it before you embarrass yourself.

I do not know or care if Mr. Murphy writes anything that's "wrong" in his treatise. Skimming it I get the distinct impression that Murphy is reciting every single thing he knows! Most of what he writes will be exceedingly boring for anyone who's studied Freshman physics. For example in the chapters where he tells us everything he knows about energy, he defines the electron-Volt. Why? He seems amused that the oxidation of one carbon atom releases 4 eV of energy. (How could we ever understand climate change without that insight? :-) ) Opening the book at random a second time, I see the poignant Figure 12.4 which contrasts the Betz and Glauert limits for wind turbine design. Do I need to know this to understand thread topic?

445 pages long is Murphy's treatise! I'll be impressed if you can find even ONE page's worth of excerpts that shed interesting and relevant light on the thread topic.
 
The bourgeois intelligentsia who write books on the obvious for the intelligentsia.
 
It remained under one billion for our entire existence, until recent times, the industrial revolution.
If you lived in 1500BCE, you could have said "It remained under one hundred milliion for our entire existence, until recent times". Why is your choice of one billion of the slightest significance, where one hundred million is not?

Why, in short, should anyone care about one billion in this context? What is special or important about "one billion" as a milestone??
 
And no, Bilby, I am not saying these are the exact figures.
But you are (incorrectly) claiming that they illustrate something other than "figures made up from pure imagination", which is what they are.

The shape of that blue line is based on absolutely no data of any kind whatsoever.

It's not a graph in support of your claim; It's a graph OF the claim itself. If I claimed that the Loch Ness Monster were real, and provided, as evidence, a sketch of what I think it might look like, then that would be exactly as persuasive as your graph here is. "Well, if it doesn't exist, how come I have a picture of it?".

That's a bit more than not being "exact figures". I could claim to have a hundred legs, and dismiss any counter-claim by saying it's not an "exact figure"; But doing that would be unhelpful and stupid.
 
Last edited:
Population growth since industrial times has been on steroids. In the 20th century, the exponential growth increased at a much faster rate, mainly due to fossil fuels.
And in the twenty first century, it collapsed, mainly due to effective oral contraceptives.

So, why should we care about the trend that used to exist??
 
Back
Top Bottom