• Welcome to the new Internet Infidels Discussion Board, formerly Talk Freethought.

We are overloading the planet: Now What?

They're not going back.
Hope not. I also hope they don’t just slide into some similar delusion that makes them think they have to breed like rabbits.
Is there any reason to think that they might?

As far as I can tell, the thing that changed wasn't motivational, psychological, or cultural; It was technological.

Women always would have preferred to have fewer children, but didn't have the means to make that desire a reality until the contraceptive pill was invented.

It's possible that people might suddenly decide that they want to slide back into using horse-drawn transport, and that the problem of clearing the manure from city streets will suddenly re-emerge. But it seems sufficiently unlikely as to not be worth wasting time worrying about it. Certainly not until they are seen to be eschewing automobiles in large numbers.
 
Condoms are a sin because they interfere with a a natural process.


Until the 1930s, the Catholic Church was not alone in its opposition to contraceptives. In the Christian tradition, birth control had long been associated with promiscuity and adultery, and resolutely condemned. However, after the Anglican Church passed a resolution in favor of birth control at its 1930 Lambeth Conference, other Protestant denominations began to relax their prohibitions as well. Nevertheless, the Catholic Church held fast to its opposition.


The Vatican's stand against contraception was centuries old. For much of that time, however, birth control had remained a dormant issue. Since most birth control consisted of folk remedies and homemade cervical caps, there was little cause for the Church to respond. It was the mass production and availability of rubber condoms and diaphragms in the 1920s and 1930s, made possible by the 1839 invention of vulcanized rubber, which eventually forced the Church to take a public position on specific contraceptives.

A Mortal Sin
On New Year's Eve 1930, the Roman Catholic Church officially banned any "artificial" means of birth control. Condoms, diaphragms and cervical caps were defined as artificial, since they blocked the natural journey of sperm during intercourse. Douches, suppositories and spermicides all killed or impeded sperm, and were banned as well. According to Church doctrine, tampering with the "male seed" was tantamount to murder. A common admonition on the subject at the time was "so many conceptions prevented, so many homicides." To interfere with God's will was a mortal sin and grounds for excommunication.
 
Condoms are a sin because they interfere with a natural process.

Technically, Adam and Eve were given the prerogative to interfere with the natural process by deliberately speeding it up - multiplying and filling the earth.

Genesis 1:28 (Repeated to Noah at Genesis 9:1)
 
Source: Murphy, Thomas W. Jr. 2021, Energy and Human Ambition on a Finite Planet , eScholarship

I've clicked TWO of your links so far, Merle. The first (six out of nine risk thresholds exceeded) seemed OK although I wasn't fond of their arithmetic. I hoped that the Deniers would devote at least a few sentences to a rebuttal.

The second link I clicked was just now, the Thomas Murphy treatise. My advice is that you remove all references to it before you embarrass yourself.

I do not know or care if Mr. Murphy writes anything that's "wrong" in his treatise. Skimming it I get the distinct impression that Murphy is reciting every single thing he knows! Most of what he writes will be exceedingly boring for anyone who's studied Freshman physics. For example in the chapters where he tells us everything he knows about energy, he defines the electron-Volt. Why? He seems amused that the oxidation of one carbon atom releases 4 eV of energy. (How could we ever understand climate change without that insight? :) ) Opening the book at random a second time, I see the poignant Figure 12.4 which contrasts the Betz and Glauert limits for wind turbine design. Do I need to know this to understand thread topic?

445 pages long is Murphy's treatise! I'll be impressed if you can find even ONE page's worth of excerpts that shed interesting and relevant light on the thread topic.
Its a college level textbook. It covers a lot of information.

The graph I posted here came from page 33 in his chapter on population. He also covers exponential growth, economic growth limits, space colonization, nuclear power, and so much more.

It is not written to be a companion to this thread, but it is a very helpful resource.
 
Population growth since industrial times has been on steroids. In the 20th century, the exponential growth increased at a much faster rate, mainly due to fossil fuels.
And in the twenty first century, it collapsed, mainly due to effective oral contraceptives.

So, why should we care about the trend that used to exist??
We care about how we got here, because it explains how overshoot could have happened. Fossil fuels have driven our population upwards at a rate far faster than the negative affects of our numbers can have their full affect on the Earth. Without fossil fuels population would have risen slowly until the Earth began to saturate, and then our numbers would have slowly leveled off following a logistics curve. But fossil fuels powered our ascent far above sustainable levels. When we have a rocket engine strapped to our back, we can soar far above the equilibrium point. That is the state we are in now.

Population has not stopped growing. It has continued to grow at the rate of about 1 billion additional people every 12 years for the last 50 years. That is a phenomenal growth rate, especially considering we are already in overshoot.
 
Last edited:
Population growth since industrial times has been on steroids. In the 20th century, the exponential growth increased at a much faster rate, mainly due to fossil fuels.
And in the twenty first century, it collapsed, mainly due to effective oral contraceptives.

So, why should we care about the trend that used to exist??
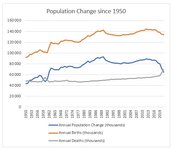
Not exactly. Here is a graph of recent population trends.
UN population Screenshot 2023-11-18 081812.jpg
Source: United Nations, 2022, Department of Economic and Social Affairs, Population Division (2022). World Population Prospects 2022, Online Edition.

The blue line shows the annual rate of population change. Yes, it came down in 2020, the last year for which I had data, but that is probably related to COVID, not to a long term trend.

We have reduced the rates of births per woman, but the number of women of child-bearing age has risen. The net result is that the annual birth rate is still not declining (orange line) and the total population has a continuous growth of about 1 billion additional people every 12 years.

I think we should try to get the blue line down close to zero in the next 15 years, with a birth rate of perhaps 1.3 per woman. That is far faster than your chart shows. I think it is doable if there is a growing recommendation for people to have fewer children, if contraceptives and abortions become more readily available, if tax laws favor fewer children, if poor countries have a means of a safety net that does not rely on having more children, if there are increased efforts to empower and educate women, etc.
 
Last edited:
If you apply anything you learn from that science the economy is no longer steady state.

That's an odd assertion. The point of new technology is that it can provide a more efficient system, doing things better and using less energy. Building a better understanding of the natural world doesn't require using more and more resources, just a constant allocation of funds for research.
You change it yet it's the same? That makes no sense.
 
You change it yet it's the same? That makes no sense.
You change your level of tech, lower your impact, raise standards of living and keep roughly the same population.
It’s almost like chewing gum and walking.
 
There's also the issue that the survivors of most any modern catastrophe will have to recover without any land mammals. They'll all go extinct as the ravenous hordes eat anything they can.
Seriously? You think that in the aftermath of a catastrophe the surviving humans will out breed and out eat the rats?

No way, Jose.

I seriously doubt that your ravening hordes could even drive livestock such as sheep, goats, cows, pigs, or horses to extinction.

Shit, in Australia, we still have somewhere in the order of one feral pig per human, despite concerted attempts to eradicate them using the best modern technology we can muster. A few starving city gents fresh from the boardroom and armed only with sharp sticks aren't going to make a dent in their numbers.

You should try catching a goat sometime. I bet you can't, even if (indeed, particularly if) you are starving.
Who said anything about catching? You can bring them down with guns (even in unarmed societies the police and military have guns), arrows or the like. When people are hungry enough (and they will be if the supply chains collapse) they'll eat whatever they can find. Primitive humans drove the megafauna to extinction, think modern man can't repeat that?
 
I just looked over the Forbes 25 list--while some started from a decent position their vast wealth is mostly self-made.
Nah, it's made on the back of first world infrastructure. Otherwise we would see as many Nigerians on the list as Americans.

Or are you of the opinion that Nigerians don't make the list because they don't work as hard, or don't have as much ambition as, Americans?
I've explained it before. The road to major riches is to do something that makes others happier or more productive with a very low marginal cost.

You need access to those to make happy or processes to improve for either of these to happen.
 
I said 'roughly' a steady because it isn't a straight line, however it took many thousands of years for us to get to a billion, after which we see an unprecedented spike in numbers. That was the point, not that there was a modest rate growth after the ice age and advent of farming, towns and cities.
Well you're right there. There was an exponential rate of growth. It wasn't "modest" at all.

It looks the same at every point. Your completely arbitrary "scare point" of one billion is no less arbitrary than one million, or ten million, or a hundred million. At each of those milestones, it was also true that "it took many thousands of years" to get there, and then we got to twice (or eight times) that number very quickly.
I think the point was missed.
 

LOL! I shared a peer-reviewed paper with you that argued that we needed to limit consumption. That paper referenced multiple peer-reviewed papers that said the same thing. Yes, peer-reviewed papers are sometimes wrong, and you have the right to dispute them. But how can you tell us that you not only refuse to accept the conclusion of this article, but you refuse to accept it is even possible, and refuse to accept it is even plausible?
The problem you have yet to address is consumption of what?

Limiting consumption of renewable resources to their production rate makes sense. However, most resource consumption is of things that are only renewed on a geological time scale if that. There is no meaningful production to balance it against.
I deal with both the consumption of renewables and non-renewables.

In the schematic graph below, I show two dips in carrying capacity. The first dip deals with the constant stress we are putting on renewable resources--such as fish and forests--as well as environmental damage beyond what the Earth can absorb--such as CO2 emissions, fertilizer runoff and loss of species. This is overshoot. And sustained overshoot overwhelms the planet, and will deteriorate the ability of the planet to hold a large population.
I believe all of the renewable ones can be solved if we are sufficiently determined. (But note that species loss is not renewable.) It will be painful but it won't do us in.

Per the Global Footprint Network, it would now take 1.75 Earths to sustain us at current consumption rates, and that number keeps growing. With continued trashing of the planet the capacity of the Earth deteriorates. Hence, I estimate that we may need to cut our consumption in half in the next 100 years or face serious consequences. If technology increases do little more than balance out future affluence increases, then the only way to reduce that negative impact is a reduction in population.

The second dip refers to loss of renewable resources, such as fossil fuels and minerals. These don't get renewed at any rate close to current consumption. And no, we will not simply recycle these minerals forever. Some minerals cannot be recycled at all, and others deteriorate with recycling. (Michaux, Simon P., 2021, The Mining of Minerals and the Limits to Growth., Geological Survey of Finland; Michaux, Simon P., 2021a, Restructuring the Circular Economy into the Resource Balanced Economy., Geological Survey of Finland.; B, 2024, Death Cults, Doomers and an End of a Civilization, Medium)

I show a representative value of the second dip at 20% of the current carrying capacity. I think you put this dip much lower, and perhaps further out in time.
I don't really count fossil fuels because they can be replaced. Minerals, though, are the sticking point. I disagree on deteriorate with recycling--that's the realm of organics. Minerals can be purified. But in time we aren't going to be able to find enough. Eventually the effort becomes too great and 20% of current is utopia compared to what I expect.

This graph changes completely depending on population, levels of affluence, and technology in use in the coming decades. I describe all this at https://mindsetfree.blog/we-are-overloading-the-planet-now-what/#Overshoot.

And no, Bilby, I am not saying these are the exact figures. As I describe in my writeup, they are representative of the two dips that Loren says I do not account for. I do indeed account for them.

And by the way, the grey curve is the middle UN projection of future population, something which people think they need to endlessly remind me of, even though I already include that in my paper.


View attachment 45328
I say you make the second one a dip rather than recognize that it goes to basically zero. Even your graph shows a declining line at the end--the greens always cut the chart off before that line intersects the zero. Most estimates show a parabolic decline in the end rather than your linear one, though.
 
Back
Top Bottom