• Welcome to the new Internet Infidels Discussion Board, formerly Talk Freethought.

What happens as we see a first world country's demographic crisis

Ok, then can you demonstrate the mechanism by which the wealth of a nation leads to a lower birthrate, if not by making childcare costs much more expensive?
I already suggested a mechanism by which a third factor could be causal in both, leading to a correlation that is not causal.

my strong suspicion is that the underlying cause of both high birth rates and poverty is a lack of educational opportunities, and that it's education that's the major factor.

The wealth of a nation may well NOT lead to a lower birth rate; Rather, the availability of education may lead BOTH to a wealthy nation, AND to lower birth rates.

You're asking me to suggest a mechanism by which increased ice-cream consumption leads to more murders*, when I merely noted that the two were correlated, and explicitly said that they likely were not cause and effect.


*Clearly that's absurd; It's obvious that the correlation is due to the fact that successfully murdering someone is usually celebrated with an ice-cream.

I don't disagree that education is a factor, but to call it the main factor seems unlikely to me. The reality is that most people do want children, and they'll have as many as they can afford.
What???

In the 19th and early 20th century, people in places like Europe and North America had 7, 8 or 9 children while living in a 25 square meter flat with not enough beds for everyone to sleep at the same time, only being able to afford meat on Sundays (*maybe* dad had the privilege of getting a slice of sausage on weekdays, but only because the hard physical labour he was doing required extra nutrition), with the kids playing unsupervised in the streets while both parents worked.

LIterally, a a professional in a first world economy, you could afford 40 kids, probably on a single wage. Which is about 30 times more than the average first world professional family is having.

sure, there were also people who lived in splendid manors with a dozen servants and a carriage of four well-fed horses on permanent standby. Do you want to make an estimate what was their percentage of the overall population, and what was their contribution to their generation's overall birth rate? Here's a small hint: Victorian novels rarely paint a representative picture of their day.
 
Last edited:
rousseau said:
I still don't think you're quite grasping that if the money doesn't add up it doesn't add up.
I still don't think you're grasping that that's not only not a new phenomenon, but it's actually less of an issue now than at any previous time in history.

Maybe in Europe. Maybe Down-Under. But it's a popular meme in the U.S.A. that "the American Dream is dead. For the first time in history, citizens no longer expect to be more prosperous than their parents."

rousseau said:
You're standing too close to the issue to be able to see the big picture. Times are hard for you, and your friends. But that doesn't mean they weren't even harder for your parents generation, and their parents generation, and so on for many generations.

You need to go back to the Medieval period to find a time when the latest generation weren't (on average) wealthier than their immediate ancestors.

By "average" I think you mean the arithmetic mean. Surely you'll agree that a statistic like median would be more appropriate here.

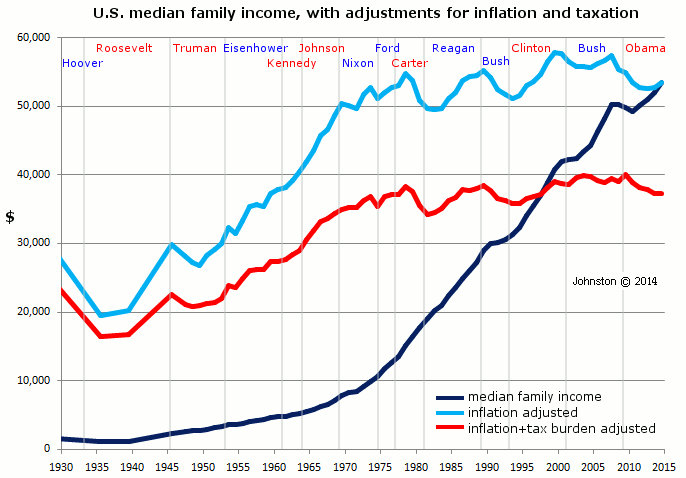
And indeed Google finds a "U.S. median family income" graph -- see below.
rousseau said:
And yet, almost everyone has always felt that they were struggling financially. And not without good reason.

My generation is most definitely (much) poorer than our parents, and subsequent generations have it even worse. I could list all the reasons why but you can safely assume that it's 'all of them'.

Most of all we live in a social framework where we need to fund our own retirement, but almost none of us have the means or support to do that. Which makes kids a non-starter.

The graph is adjusted for inflation and taxation. I think it should also be adjusted for per-capita GDP -- the total "pie" is much bigger than before, so family income has SHRUNK substantially as a share of the pie.

For that and other reasons (including rousseau's mentions) this graph paints a poignant picture about the state of "the American Dream" since the Carter Administration.

mfi3.gif
 
Maybe in Europe. Maybe Down-Under. But it's a popular meme in the U.S.A. that "the American Dream is dead. For the first time in history, citizens no longer expect to be more prosperous than their parents."

I can't speak for Australia, but in Canada my generation and those younger have it substantially harder than our parents. Literally every single variable about our lives is harder, to the point that quite a few of us can barely afford to house ourselves, let alone raise even a single kid.

I'll try to list the variables out for illustrative purposes:
  • The Canadian economy is becoming increasingly hollowed out, and high paying, secure jobs are hard to find and hold on to
  • Pension plans outside of the public sector essentially no longer exist
  • There is an actual housing crisis, and a substantial number of people can't afford to buy a home or even rent
  • The cost of food, tuition, and vehicles have gone up substantially
  • A university degree is almost worthless in today's economy, but having a degree or diploma is still absolutely necessary to find a good salary
  • Childcare costs are extremely high, and even getting your kid into a daycare is difficult
There's probably more, but I think you get the idea. I wouldn't just call our lives harder, I'd say that those my age and younger have very serious problems to attend to. When we reach retirement age there is going to be substantial social disorder.
 
By "average" I think you mean the arithmetic mean. Surely you'll agree that a statistic like median would be more appropriate here.
The claim is equally true in both cases; But you are right that the median is the better measure (and it also happens to better support my claim).
 
this graph paints a poignant picture about the state of "the American Dream" since the Carter Administration.
The graph paints a poignant picture of a US public who are bizarrely convinced that their taxes are pure waste, and get them nothing whatsoever of value.

In the real world, taxes go to infrastructure and services that would otherwise be less efficiently provided by direct personal expenditure.

Declaring a population to be worse off after tax is insanity.
 
I can't speak for Australia, but in Canada my generation and those younger have it substantially harder than our parents. Literally every single variable about our lives is harder, to the point that quite a few of us can barely afford to house ourselves, let alone raise even a single kid.
Yeah, what's harder is that back then, somebody else was doing it. Now the burden falls on you, and suddenly you understand how huge that burden is - but it was no less in the past.

Your parents may have been better off than you are; But their generation as a whole certainly were not, and they had it just as tough - indeed tougher.

Life has always been a struggle. Only recently has it been a struggle most people don't expect to kill them (or their children).
 
Life has always been a struggle. Only recently has it been a struggle most people don't expect to kill them (or their children).

Well, in my city there are ten times more homeless people now than there were five years ago. So maybe we are starting to move toward 'expect to kill them' territory again.

I don't think you can really use the distant past as a metric for what's happening now. In the past one hundred years we changed the very fabric of society to rely on high wages, and the expectation that there was a reliable safety net when we were no longer able to work. The trouble is, for my generation there literally is no safety net, none. What's going to happen when an entire generation of people who are still renting, have negligible retirement savings, and no pension to speak of, can no longer work?

Sure, things weren't perfect for the boomers and a lot of people struggled. For my generation and later the economy is a disaster, and if you can't see that you're not looking closely enough.

For reference, here's an article that came out in Canada recently:


“The coming period of recession will … accelerate the decline in living standards that the younger generations have already witnessed compared to earlier generations,” reads the report, entitled Whole-of-Government Five-Year Trends for Canada.

“For example, many Canadians under 35 are unlikely ever to be able to buy a place to live,” it adds.

In addition to worsening living standards, the RCMP also warns of a future increasingly defined by unpredictable weather and seasonal catastrophes, such as wildfires and flooding. Most notably, report authors warn of Canada facing “increasing pressure to cede Arctic territory.”

“Economic forecasts for the next five years and beyond are bleak,” reads the RCMP’s assessment of the rest of the decade, even adding a quote from French President Emmanuel Macron that “the end of abundance” is nigh.

But apparently people who are 60 and over report that Canada is the 8th happiest country in the world.
 
By "average" I think you mean the arithmetic mean. Surely you'll agree that a statistic like median would be more appropriate here.
The claim is equally true in both cases; But you are right that the median is the better measure (and it also happens to better support my claim).

Look again. The blue line and the red line tell essentially the SAME story: Stagnation after the Carter Administration.
As I said, factoring out productivity gains would make the point much clearer, and is easy to do. But what would be the point in a "discussion" with YOU?
 
Declaring a population to be worse off after tax is insanity.

Social services provided with tax dollars DECLINED after Carter. The reason for the greater tax burden for the median family was changes in the tax structure that took from the median taxpayer to enrich the already rich. And taxes for "defense" budgets which INCREASED under Reagan et al.

"insanity"? No . . . but somebody isn't demonstrating cognitive aptitude.
That would be the person who expects others to include in their deliberations data not in evidence. None of this appears on your graph; If you felt that the graph needed that information in order to support your point, you could and should have included it.
 

For that and other reasons (including rousseau's mentions) this graph paints a poignant picture about the state of "the American Dream" since the Carter Administration.

mfi3.gif
There's a fundamental flaw in that chart that the author should have known about so I'm left with the conclusion that this is deliberate deception. Specifically, look what has happened to family size over that time. They are using family income, not per-capita income, because that is being reduced by the fact that an awful lot more people now live in single-adult households. That line isn't as flat as you think it is.
 
Are government statistics prepared by people who are stupid and/or malicious? I think right-wingers would argue that is so. Those on the left, however, might argue that malicious people tend to be right-wingers who practice their malice for profit in the private sector.

There's a fundamental flaw in that chart that the author should have known about so I'm left with the conclusion that this is deliberate deception. Specifically, look what has happened to family size over that time. They are using family income, not per-capita income, because that is being reduced by the fact that an awful lot more people now live in single-adult households. That line isn't as flat as you think it is.

Good point! Or rather, it WOULD be a good point if single-person "households" were included in the stat -- I don't think they are. And the portion of families with TWO working adults has increased over time; that would skew the stat in the OPPOSITE direction.

But these objections would be mitigated IF
These limits are based on HUD estimates of median family income, with adjustments based on family size.
The "adjustments", BTW, are non-trivial -- so weird or complex that they would provide scope for further quibbling. There are "economies of scale"! Children are less expensive than adults (unless you factor in saving or paying for college -- again a recently growing problem which would therefore skew the data implications in the OPPOSITE way that Loren fears).

The URL where the graph appears is shown above. It cites several sources, one of which I tracked down in the Wayback Machine.
Loren, perhaps you will study those documents and report on their "adjustments based on family size." Thanks in advance.
 
Back
Top Bottom