• Welcome to the new Internet Infidels Discussion Board, formerly Talk Freethought.

The World-O-Meter Thread

Not entirely accurate perhaps, but much more so than those who think we are still in exponential growth or that we will see 5k deaths/day.
5k is closer than your prediction of max 2k.

Think again. The 7 day average, which is the metric I always use since raw dailies are too erratic to be useful, is at ~2.5k.

And I noticed you did not even attempt to defend the notion that we are still growing exponentially.
 
Unfortunately, slowing down doesn't mean stopping. 247,000 new cases and 3,486 fatalities so far today, the latter a new record and the former a very close second. (ETA: Those were the final numbers for the day.)

Yesterday's spoke was caused almost entirely by California jumping from ~30k/d to ~60k/d. That is certainly a reporting anomaly and not a true picture, especially with all the strict lockdown measures in many of the counties, including LA County, which reported ~22k cases yesterday.

I stand by the prediction I made earlier: a bumpy plateau through the first week of January (so about 3 more weeks and change) until the Christmas effects (both reporting anomalies and people travelling and getting together) level off. After that, a relatively steep downslope through Winter and Spring.
 
The upslope is usually steeper than the downslope.

The previous two peaks, especially 1a in Spring, did not affect the entire country. When you add up numbers from the entire country and say Northeast is going down but some other areas are picking up, the superposition led to a less steep overall slope. The same thing happened after the 1b (Summer) peak. This peak (1c/2 let's call it as it is part of first wave in some parts of the country but it also swung back on areas like Northeast (1a) or Georgia (1b) so it is in effect proper second wave in those areas) has left no part of the country unaffected and no place has had low exposure except perhaps Vermont and parts of Maine. So there is no upslope to superimpose with the downslope.
It is also very significant that we have vaccines now for the first time. So coming down 1c/2 come January will be pretty steep I think.
 
Not entirely accurate perhaps, but much more so than those who think we are still in exponential growth or that we will see 5k deaths/day.
5k is closer than your prediction of max 2k.

Think again. The 7 day average, which is the metric I always use since raw dailies are too erratic to be useful, is at ~2.5k.

Okay, then still wrong, but by not as much, for now.

And I noticed you did not even attempt to defend the notion that we are still growing exponentially.

Why would I need to?
 
Not entirely accurate perhaps, but much more so than those who think we are still in exponential growth or that we will see 5k deaths/day.
5k is closer than your prediction of max 2k.

Think again. The 7 day average, which is the metric I always use since raw dailies are too erratic to be useful, is at ~2.5k.

And I noticed you did not even attempt to defend the notion that we are still growing exponentially.
This exponential vs linear growth quibble has been going on through several phases of both.
Maybe it's time to let the fucking graphs speak for themselves, if we can agree that an increasingly steep slope indicates exponential growth.

Meanwhile, yesterday (Wednesday 12/16) was another record. We routinely see increases from Wednesdays through Fridays... which would dash my hopes that the new infection rates were topping out.
The geometry of the "deaths" curve says it's not very near peak - not surprising, as it lags some very stiff increases in new cases by weeks. 4k deaths a day looks inevitable (though hopefully not as a 7 day average). 5k/day is not out of the realm of possibility.
Looks pretty grim.
 
I predict a bumpy plateau until maybe the 2nd week of January (around Epiphany/Orthodox Christmas).
^ Posted 12/15

That bumpy plateau has yet to plateau. New records above 250k new cases/day on two of the last three days.
I'm pretty disappointed - like you I was expecting to see the curve leveling off about now.
At least we have the Christmas (under)reporting anomaly coming to cheer us up.

I take it that you are expecting an persistent decline in new case number to set in, starting in mid January.
If the current administration has anything to say about it, that's not going to happen.

You decrease the slope until it goes to zero and then negative. Duh.

Been there, done that, got the t-shirt.
TWICE.
And we're in worse shape than ever. Duh.
 
I predict a bumpy plateau until maybe the 2nd week of January (around Epiphany/Orthodox Christmas).
^ Posted 12/15

That bumpy plateau has yet to plateau. New records above 250k new cases/day on two of the last three days.

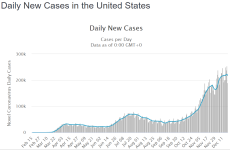
Looks just like a bumpy plateau to me.
bumpyplateau.png

I'm pretty disappointed - like you I was expecting to see the curve leveling off about now.

Then you must be relived now.

I take it that you are expecting an persistent decline in new case number to set in, starting in mid January.
If the current administration has anything to say about it, that's not going to happen.

My prediction is not about administrations anyway. Trump mismanaged it, but the damage has been done. Not much that can be done now, one way or another.

Been there, done that, got the t-shirt.
TWICE.
And we're in worse shape than ever. Duh.

But we are in a much better shape than what was predicted early in the pandemic because there were some really catastrophic predictions early on.

We also never had the bad situation they had in Lombardy for a while.
 
This exponential vs linear growth quibble has been going on through several phases of both.
It's not a quibble and not every non-linear curve is exponential.

Maybe it's time to let the fucking graphs speak for themselves, if we can agree that an increasingly steep slope indicates exponential growth.

Not necessarily. A slope proportional to the number of cases indicates exponential growth.
dy/dx=ry

Words have meanings.

Meanwhile, yesterday (Wednesday 12/16) was another record. We routinely see increases from Wednesdays through Fridays... which would dash my hopes that the new infection rates were topping out.
The geometry of the "deaths" curve says it's not very near peak - not surprising, as it lags some very stiff increases in new cases by weeks. 4k deaths a day looks inevitable (though hopefully not as a 7 day average). 5k/day is not out of the realm of possibility.
Looks pretty grim.

Again, you need to stop focusing so hard on daily numbers. Second, bumpy plateau will have periods of increase and decrease. That's what makes it bumpy.
 
... bumpy plateau will have periods of increase and decrease. That's what makes it bumpy.
By your preferred word definitions, we have had a "bumpy plateau" ever since last march.
Certainly you can reserve the right to define your way out of being wrong, but the facts are what they are.
As long as we keep posting new records - daily and by three or seven day averages - we are NOT in a "plateau".
We set records for ALL THREE on December 18th. (254,686 1-day, 247,577 3-day, 222,673 7-day)
We are not (yet) at any "plateau", QED.

That we will someday see a "bumpy plateau" is hardly a bold - or even meaningful - prediction.

Exactly. The graph always flattens out in the last week--but when you reexamine the old graph that flattening is generally gone. It's reporting lag.
 
Exactly. The graph always flattens out in the last week--but when you reexamine the old graph that flattening is generally gone. It's reporting lag.
Not so. I think I now understand what you mean. There is often an adjustment for the past day, but it is usually minor and does not affect any days before the day before anyway. And the graph is mot certainly not always flattening.

As much as you hope that we are still growing exponentially, the bumpy plateau that is evident in the graph will not disappear.
 
By your preferred word definitions, we have had a "bumpy plateau" ever since last march.

Now you are just getting silly! Look at the graph I posted. It looks just like a bumpy plateau and as you quoted me, I said that this will happen 5 days ago.

That we will someday see a "bumpy plateau" is hardly a bold - or even meaningful - prediction.
We are in the middle of it. The prediction is that the bumpy plateau is now, will last until about the beginning of 2nd week of January, followed by .
How bold or meaningful you thin it is is up to you of course, but I never said "someday".
 
By your preferred word definitions, we have had a "bumpy plateau" ever since last march.

Now you are just getting silly!

True. To illustrate that it is simply a matter of scale. I don't expect to see any stats on the WOM site that will reflect the actual state of affairs any time soon, really.
This coming week will be Christmas, the next week will be New years, the following week will have the GA runoffs and the Trump Coup attempt the day after that, then the inauguration (or inaugural massacre if Trump gets his way) after the following week. Hopefully there will be a world-o-meter by March 27th, so we can have a seven day average by April 4th, right?

Look at the graph I posted. It looks just like a bumpy plateau and as you quoted me, I said that this will happen 5 days ago.

It is easy to observe that from march until now the overall trend has been toward increase. It is still increasing afaics. It's safe to say that it will increase until it doesn't, and that then the overall trend will be downward. We have a bet that is based on a difference of opinion regarding where we will be by April 4th, which in turn depends on when the overall trend will be downward and how steep the rate of decrease will be. No point in arguing over the shape of coming curves - we already have a bet on that.
 
True. To illustrate that it is simply a matter of scale. I don't expect to see any stats on the WOM site that will reflect the actual state of affairs any time soon, really.
This coming week will be Christmas, the next week will be New years,
All true and that will cause some messiness to the data like Thanksgiving. Also maybe a Christmas-induced actual spike but that will probably be dampened a lot by counties imposing new rules and by natural downslope from a peak. The Christmas spike is one main reason why I predict a longish plateau and only a net decline of cases after the Christmas mess is over.

the following week will have the GA runoffs and the Trump Coup attempt the day after that, then the inauguration (or inaugural massacre if Trump gets his way) after the following week.
Holy paranoia Batman! Apart from your fear of some sort of armed conflict, I do not think the GA runoff will be that much of a spreader event, although it will cause increase in cases in Georgia. The turnout is high in early voting (unusual for a runoff) and there are long lines at early polling places at times. But that will affect only one state (mine) and thus should have no major impact on national numbers. 1k/d extra cases (for example) is a good chunk of total 5k-6k/d we are running now but is less than 1% of the national numbers. And since the inauguration will be mostly virtual, that will not be a superspreader event either.

Hopefully there will be a world-o-meter by March 27th, so we can have a seven day average by April 4th, right?
Yeah, sure. I hope so too. Even if I don't have quite the same fears of impending societal collapse you seem to have.

I am more afraid this new British mutation might cause you to win. Let's hope the vaccine works just as well against that variant and also that the mutation introduced some weakness into it.

It is easy to observe that from march until now the overall trend has been toward increase. It is still increasing afaics.
The trends have reversed. What is notable is the regional spread during the three spikes we have had. The 1a spike was still the worst afaik but it was much more concentrated in the NE and also a lot more cases went unreported because testing was less available than later on.

And I disagree we are still growing. Daily cases are fluctuating, but do not seem to show much of a net increase since December 13th or so. That's a full week of relatively good news.

It's safe to say that it will increase until it doesn't, and that then the overall trend will be downward. We have a bet that is based on a difference of opinion regarding where we will be by April 4th, which in turn depends on when the overall trend will be downward and how steep the rate of decrease will be. No point in arguing over the shape of coming curves - we already have a bet on that.

Sure. Time will tell. And if you win, thank the British mutation. :) However, afaik both the Pfizer and Moderna vaccines are designed to target multiple epitopes on the spike protein, so I doubt a single mutation would affect their effectiveness.
 
Damn Derec that was a pretty rational post. I'm surprised.

I don't plan to be the second sacrifice to American capitalism to profit in my family in the last 100 years. Lost grandmother in 1918, twenty-two years before I was born.

As for mutations they will work themselves out with the most successful version being the longest lasting.
 
I disagree we are still growing.

In the intervening week (since 12/13) we have had two single day all-time records. As long as that continues to be the case, I see it as "growing". We may be at "peak" now - I don't know.
Other than that we seem to agree on things in general. I really don't harbor the cynical view you ascribe to me; most of my "societal meltdown"/military coup allusions are tongue in cheek mockery of the charade s that Trump is putting us through. I don't blame you for not getting that; this medium doesn't lend well to non-literal expression.
If it's any consolation, I don't believe any of those pipe dreams of Trump's are going to come true.
I think the major difference in our opinions is regarding the slope of decreasing infections. You seem far more optimistic than I am about "herd immunity", the distribution of vaccines, and their effect by April 4. We shall see whose gut feeling turns out to be more prescient.
BTW, if I should win that bet, I will ask that you make a $100 contribution to TFT (in the name of "Elixir" of course). I'll ask Zipr to confirm receipt. OK?

ETA: I don't think the British mutation has (yet) effected the surface protein (binding site), so the current vaccines should remain effective, pending further mutations. Professionals' best guess to date is that we will need modified vaccines in about three years.
 
Exactly. The graph always flattens out in the last week--but when you reexamine the old graph that flattening is generally gone. It's reporting lag.
Not so. I think I now understand what you mean. There is often an adjustment for the past day, but it is usually minor and does not affect any days before the day before anyway. And the graph is mot certainly not always flattening.

As much as you hope that we are still growing exponentially, the bumpy plateau that is evident in the graph will not disappear.

It's a lot more than a day of corrections.
 
It's a lot more than a day of corrections.

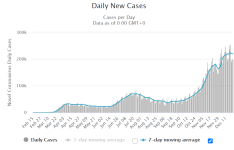
I don't think so. But it's easy to find out. This is the snapshot as of today.
daily.png
It shows a bumpy plateau between about 12/10 and now.

We will check the graph of 12/10 - 12/22 in a week or two. If you are right, the bumpy plateau should be replaced by a noticeable upslope. If I am right, it will not be significantly changed.
 
Exactly. The graph always flattens out in the last week--but when you reexamine the old graph that flattening is generally gone. It's reporting lag.
Not so. I think I now understand what you mean. There is often an adjustment for the past day, but it is usually minor and does not affect any days before the day before anyway. And the graph is mot certainly not always flattening.

As much as you hope that we are still growing exponentially, the bumpy plateau that is evident in the graph will not disappear.

It's a lot more than a day of corrections.
We aren't exponential. But we are growing. Generally best to compare today's numbers with the one seven days ago. That shows continued growth... which is slowing due to new restrictions in several states, and holding back that pulse of new cases from T-Day stupidity. And now with Xmas, a lot of self-entitled assholes are going to spread this a bit more. The death tolls have risen, in predictable fashion, and we might reach a 7-day average of 3,000 a day.

The US is in a prevent defense and giving up yards like crazy.
 
Back
Top Bottom